- Minimally Invasive Surgery plus r-tPA for Intracerebral Hemorrhage Evacuation (MISTIE)
- Multi-center, multi-national Phase II clinical trial
- Alteplase (donated by Genentech)

PI: Dr. Dan Hanley 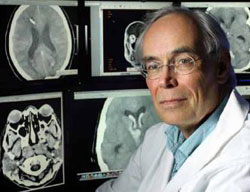
January 19, 2017
PI: Dr. Dan Hanley

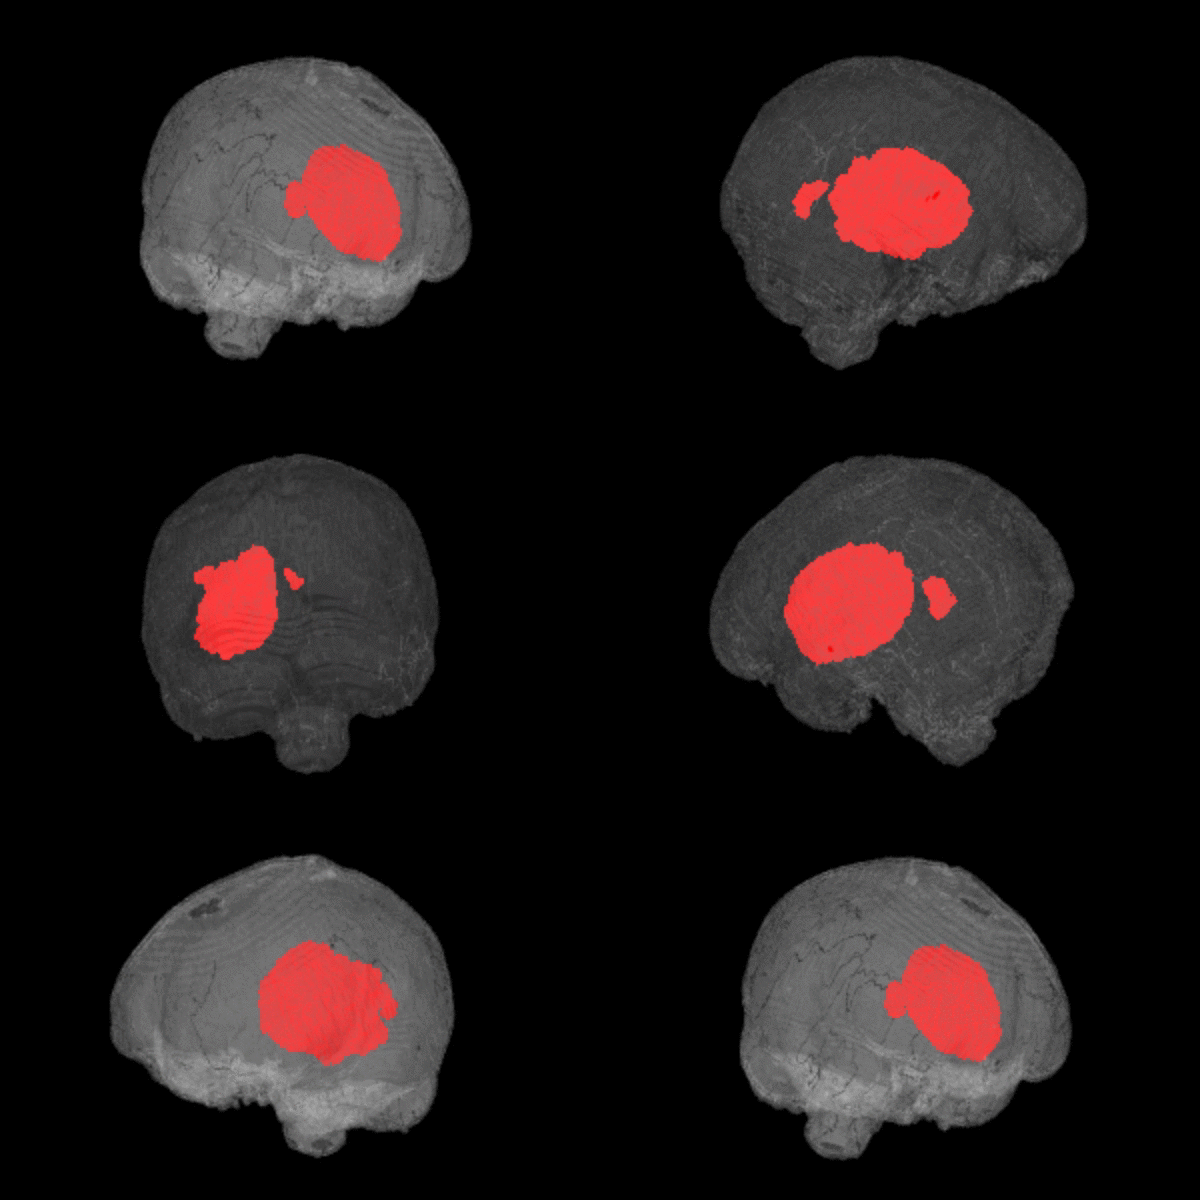
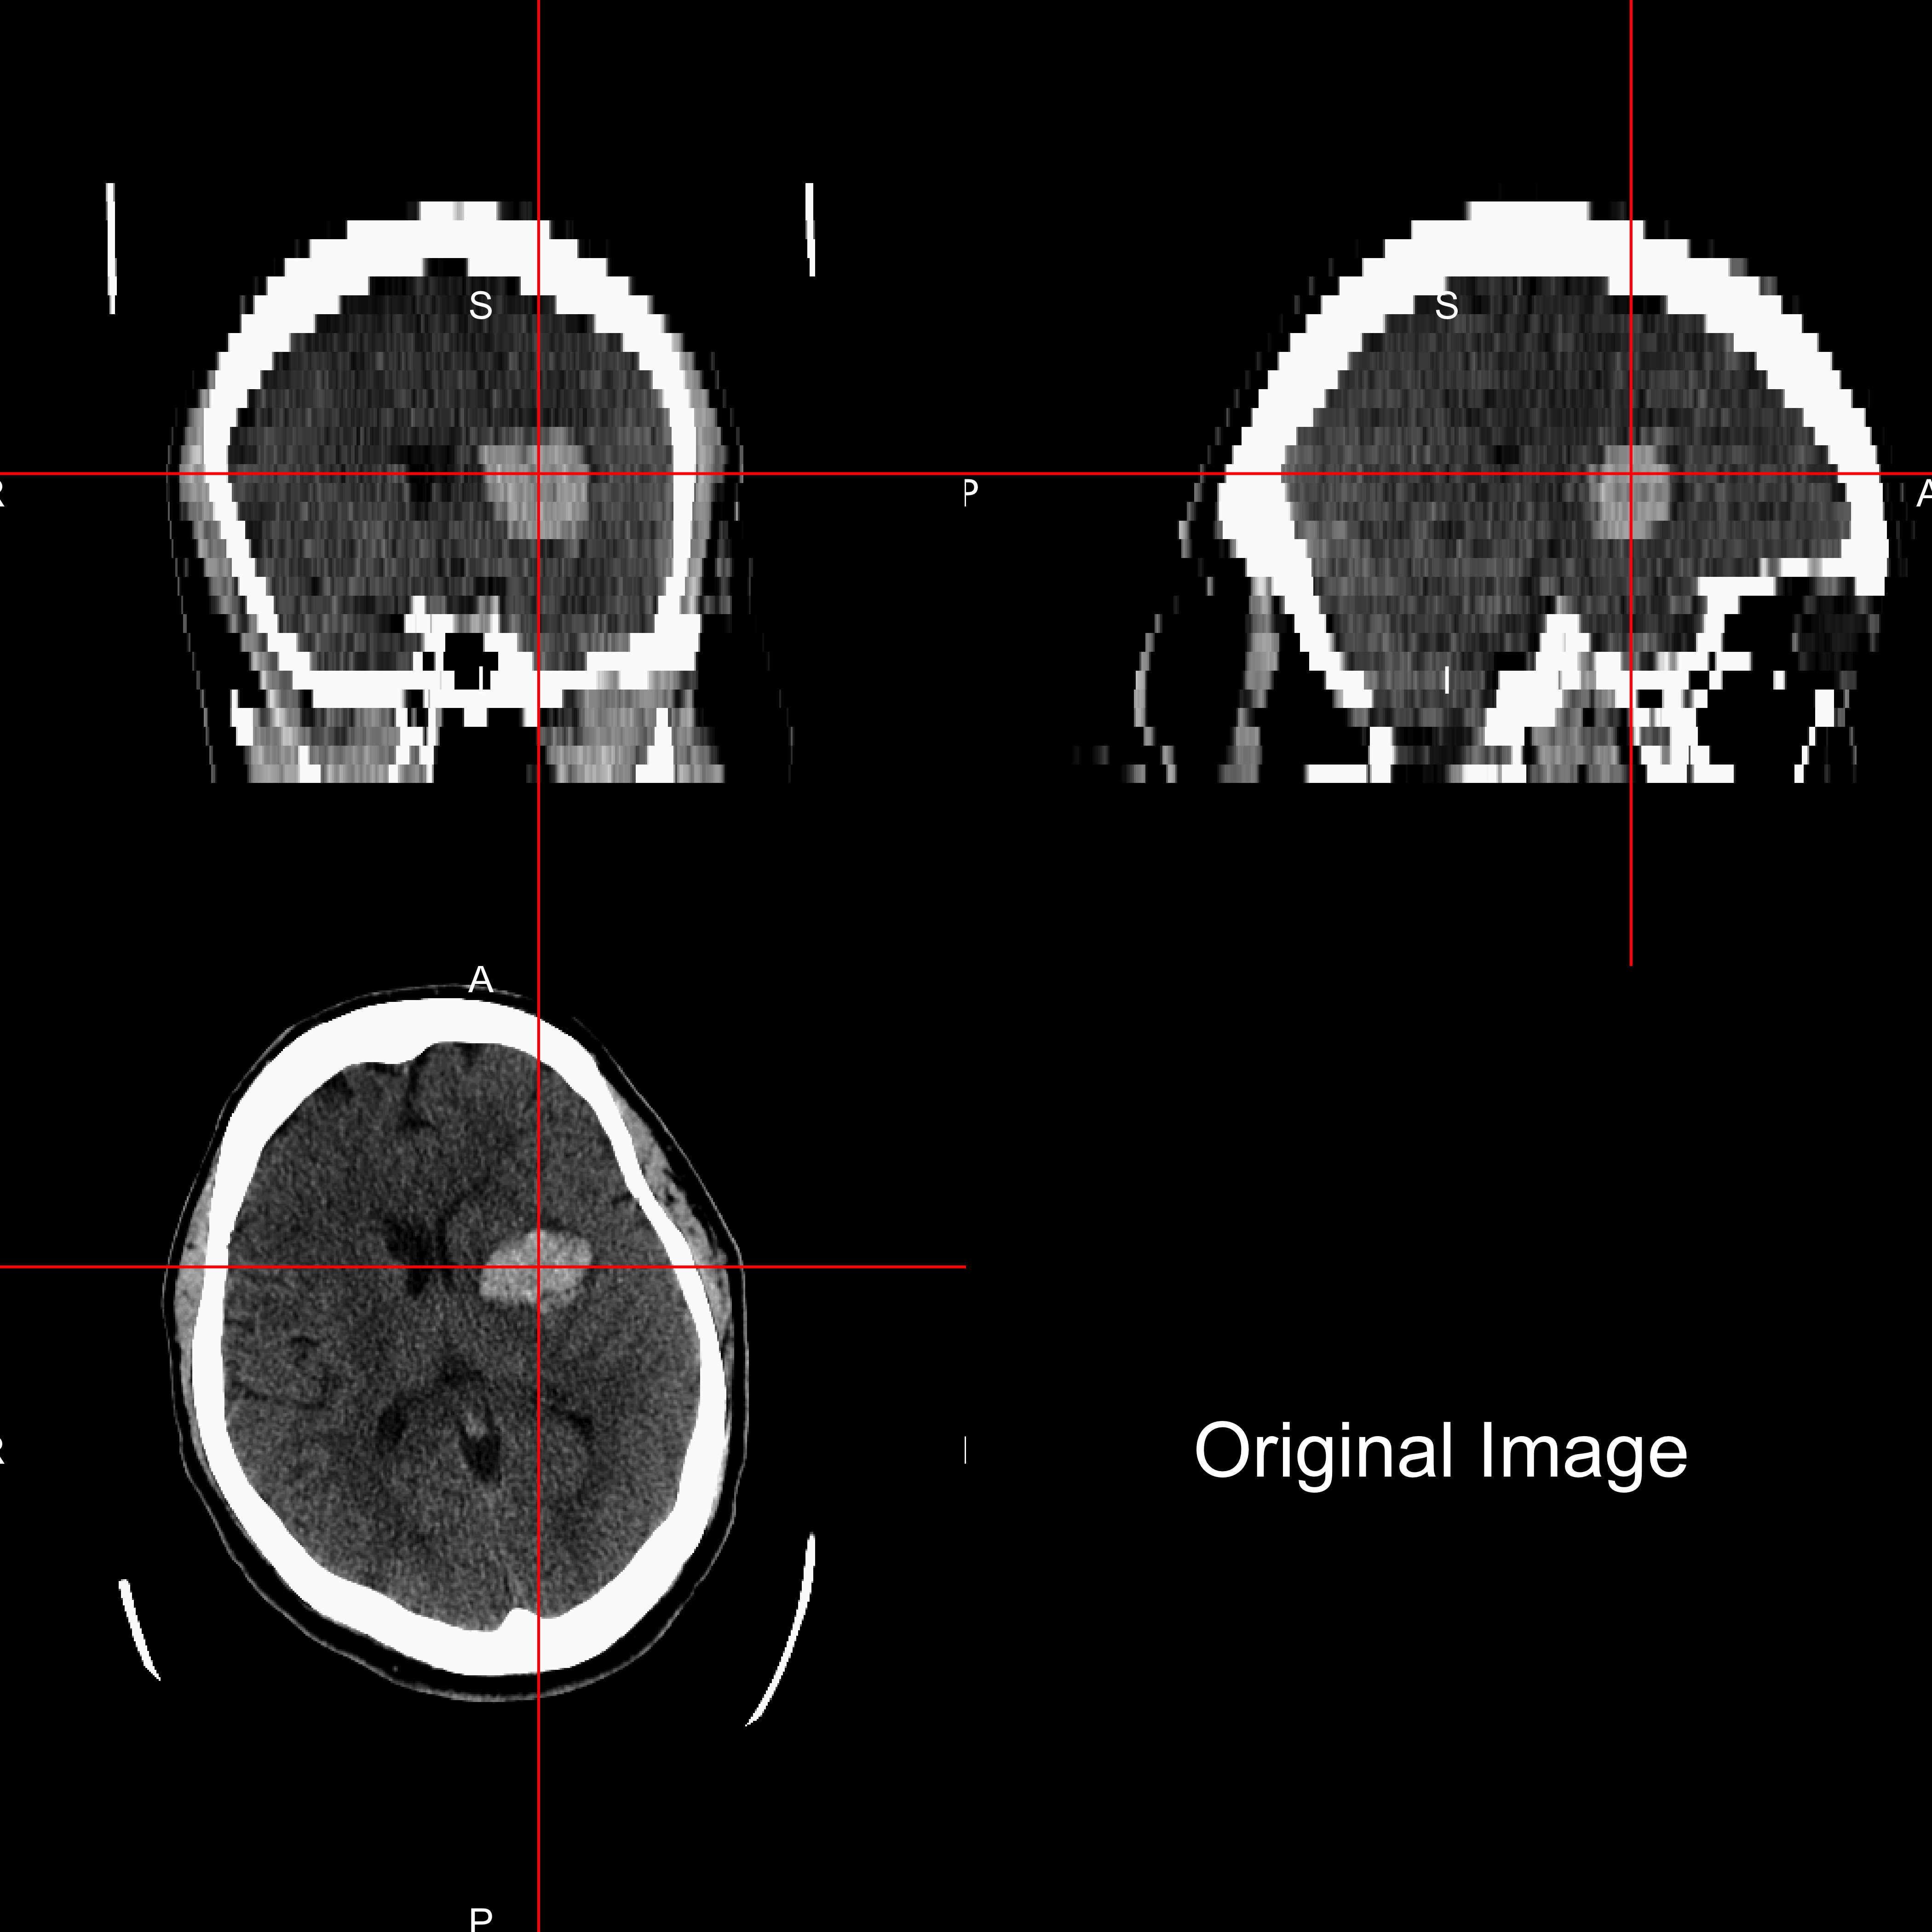
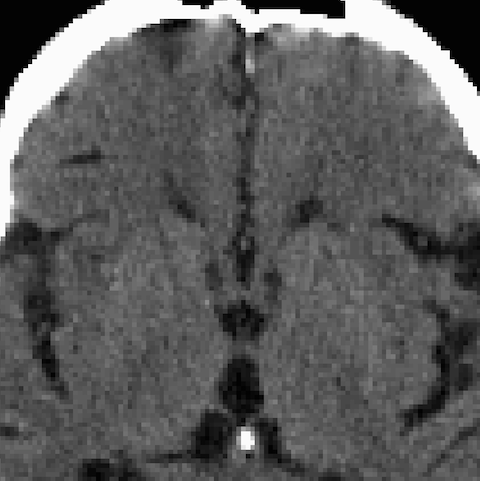
Typical CT has \(512 \times 512 \times 30 ≈ 7.8\) million voxels
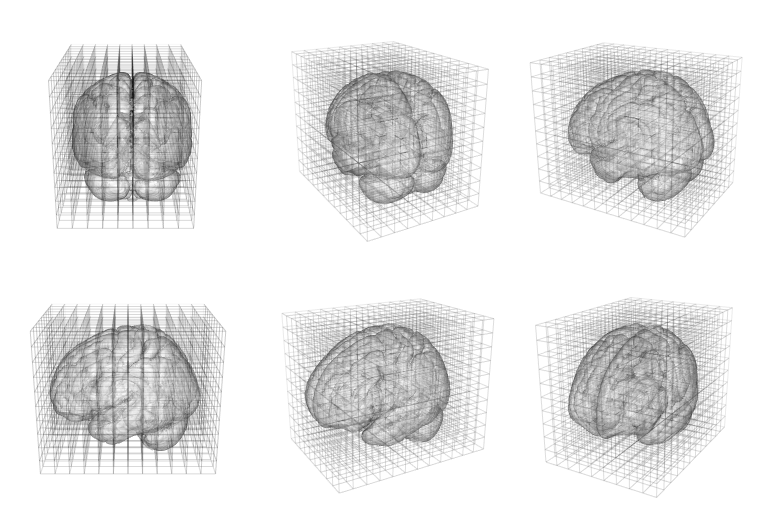
Muschelli, John, Elizabeth Sweeney, and Ciprian Crainiceanu. "brainR: Interactive 3 and 4D Images of High Resolution Neuroimage Data." R JOURNAL 6.1 (2014): 42-48.

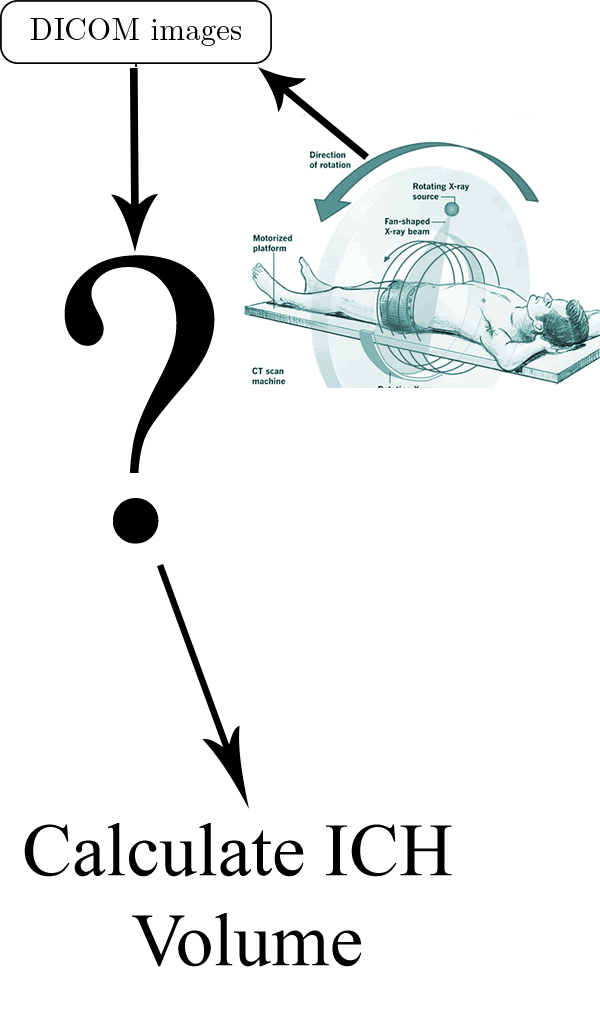
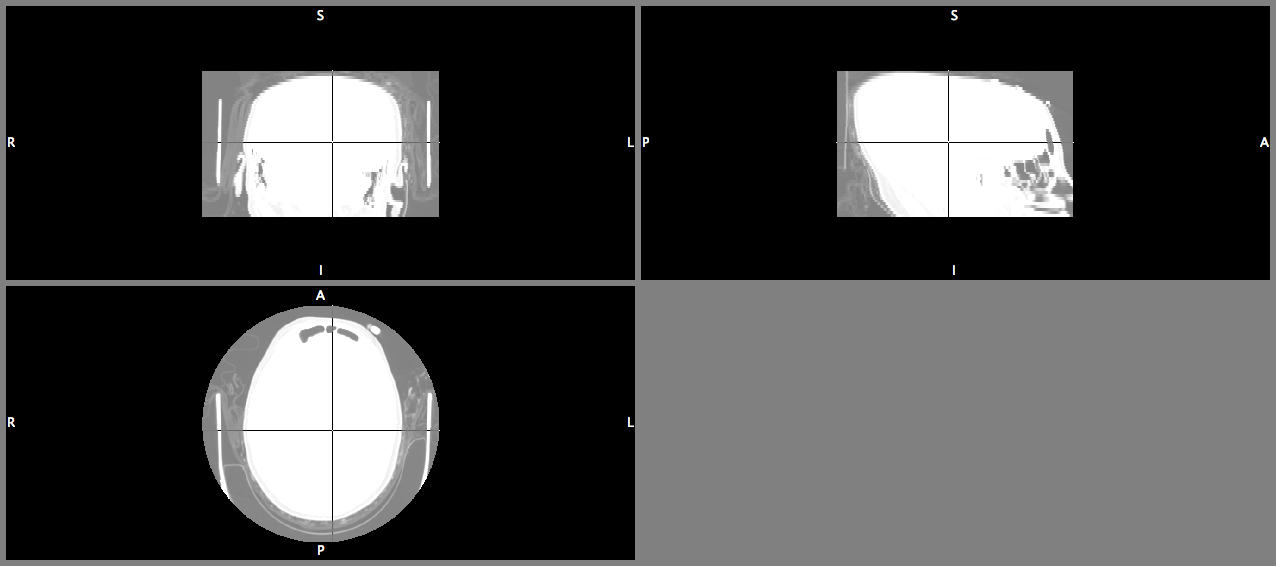
Also has negative values
| Overall | |
|---|---|
| Age in Years: Mean (SD) | 60.8 (11.2) |
| Male: N (%) | 76 (68.5%) |
| Reader-Based Clot Location (%) | |
| Putamen | 68 (61.3) |
| Lobar | 33 (29.7) |
| Globus Pallidus | 6 ( 5.4) |
| Thalamus | 4 ( 3.6) |
| ICH Volume in mL: Mean (SD) | 37.4 (20.1) |
Local Mean: \(\bar{x}(v) = \frac{1}{27} \sum\limits_{k}^{27} x_k(v)\) 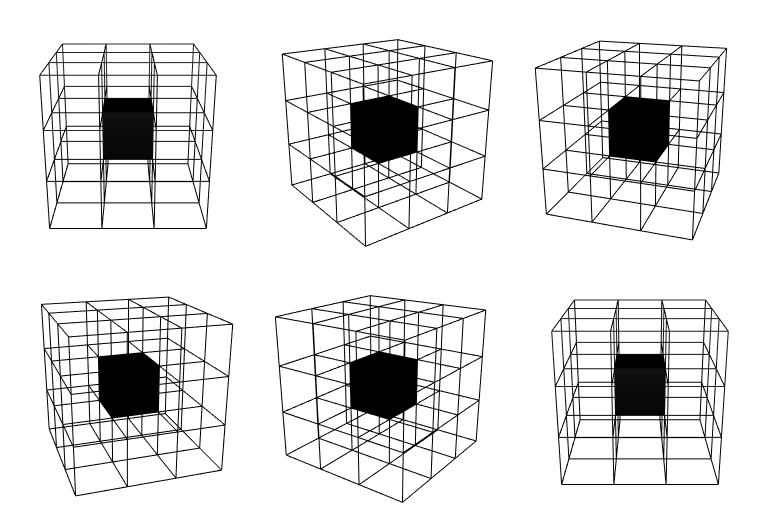
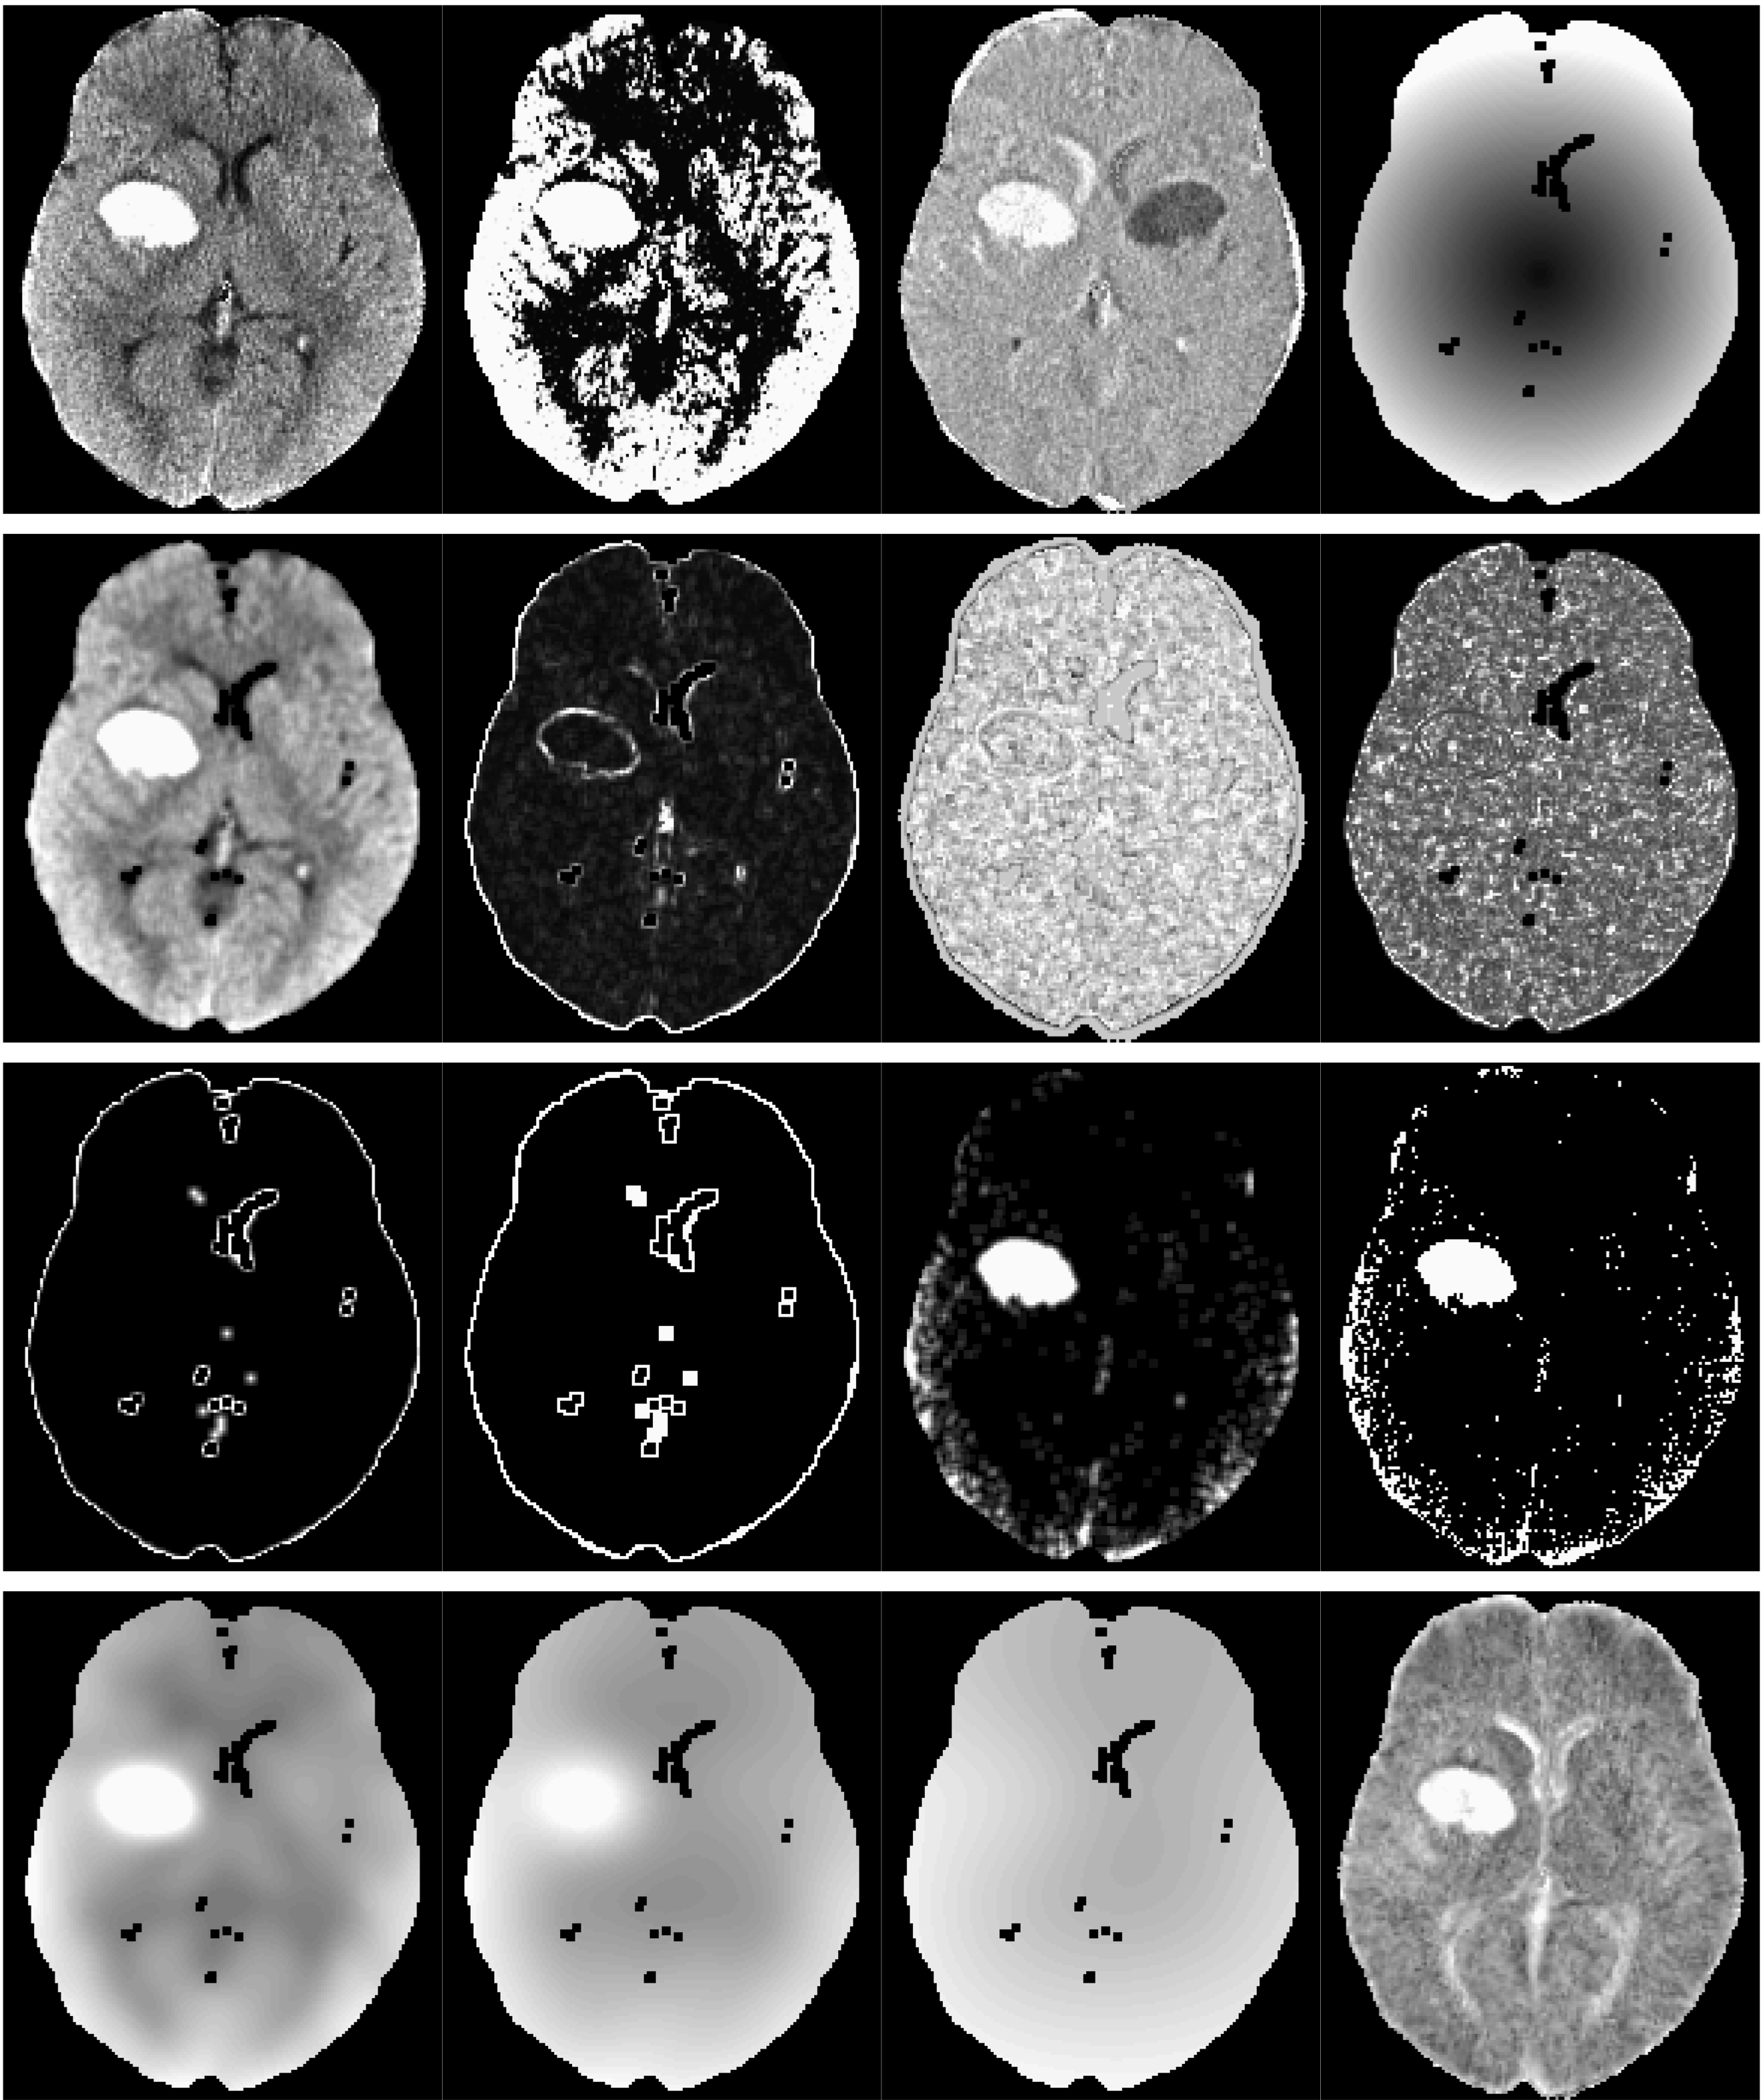
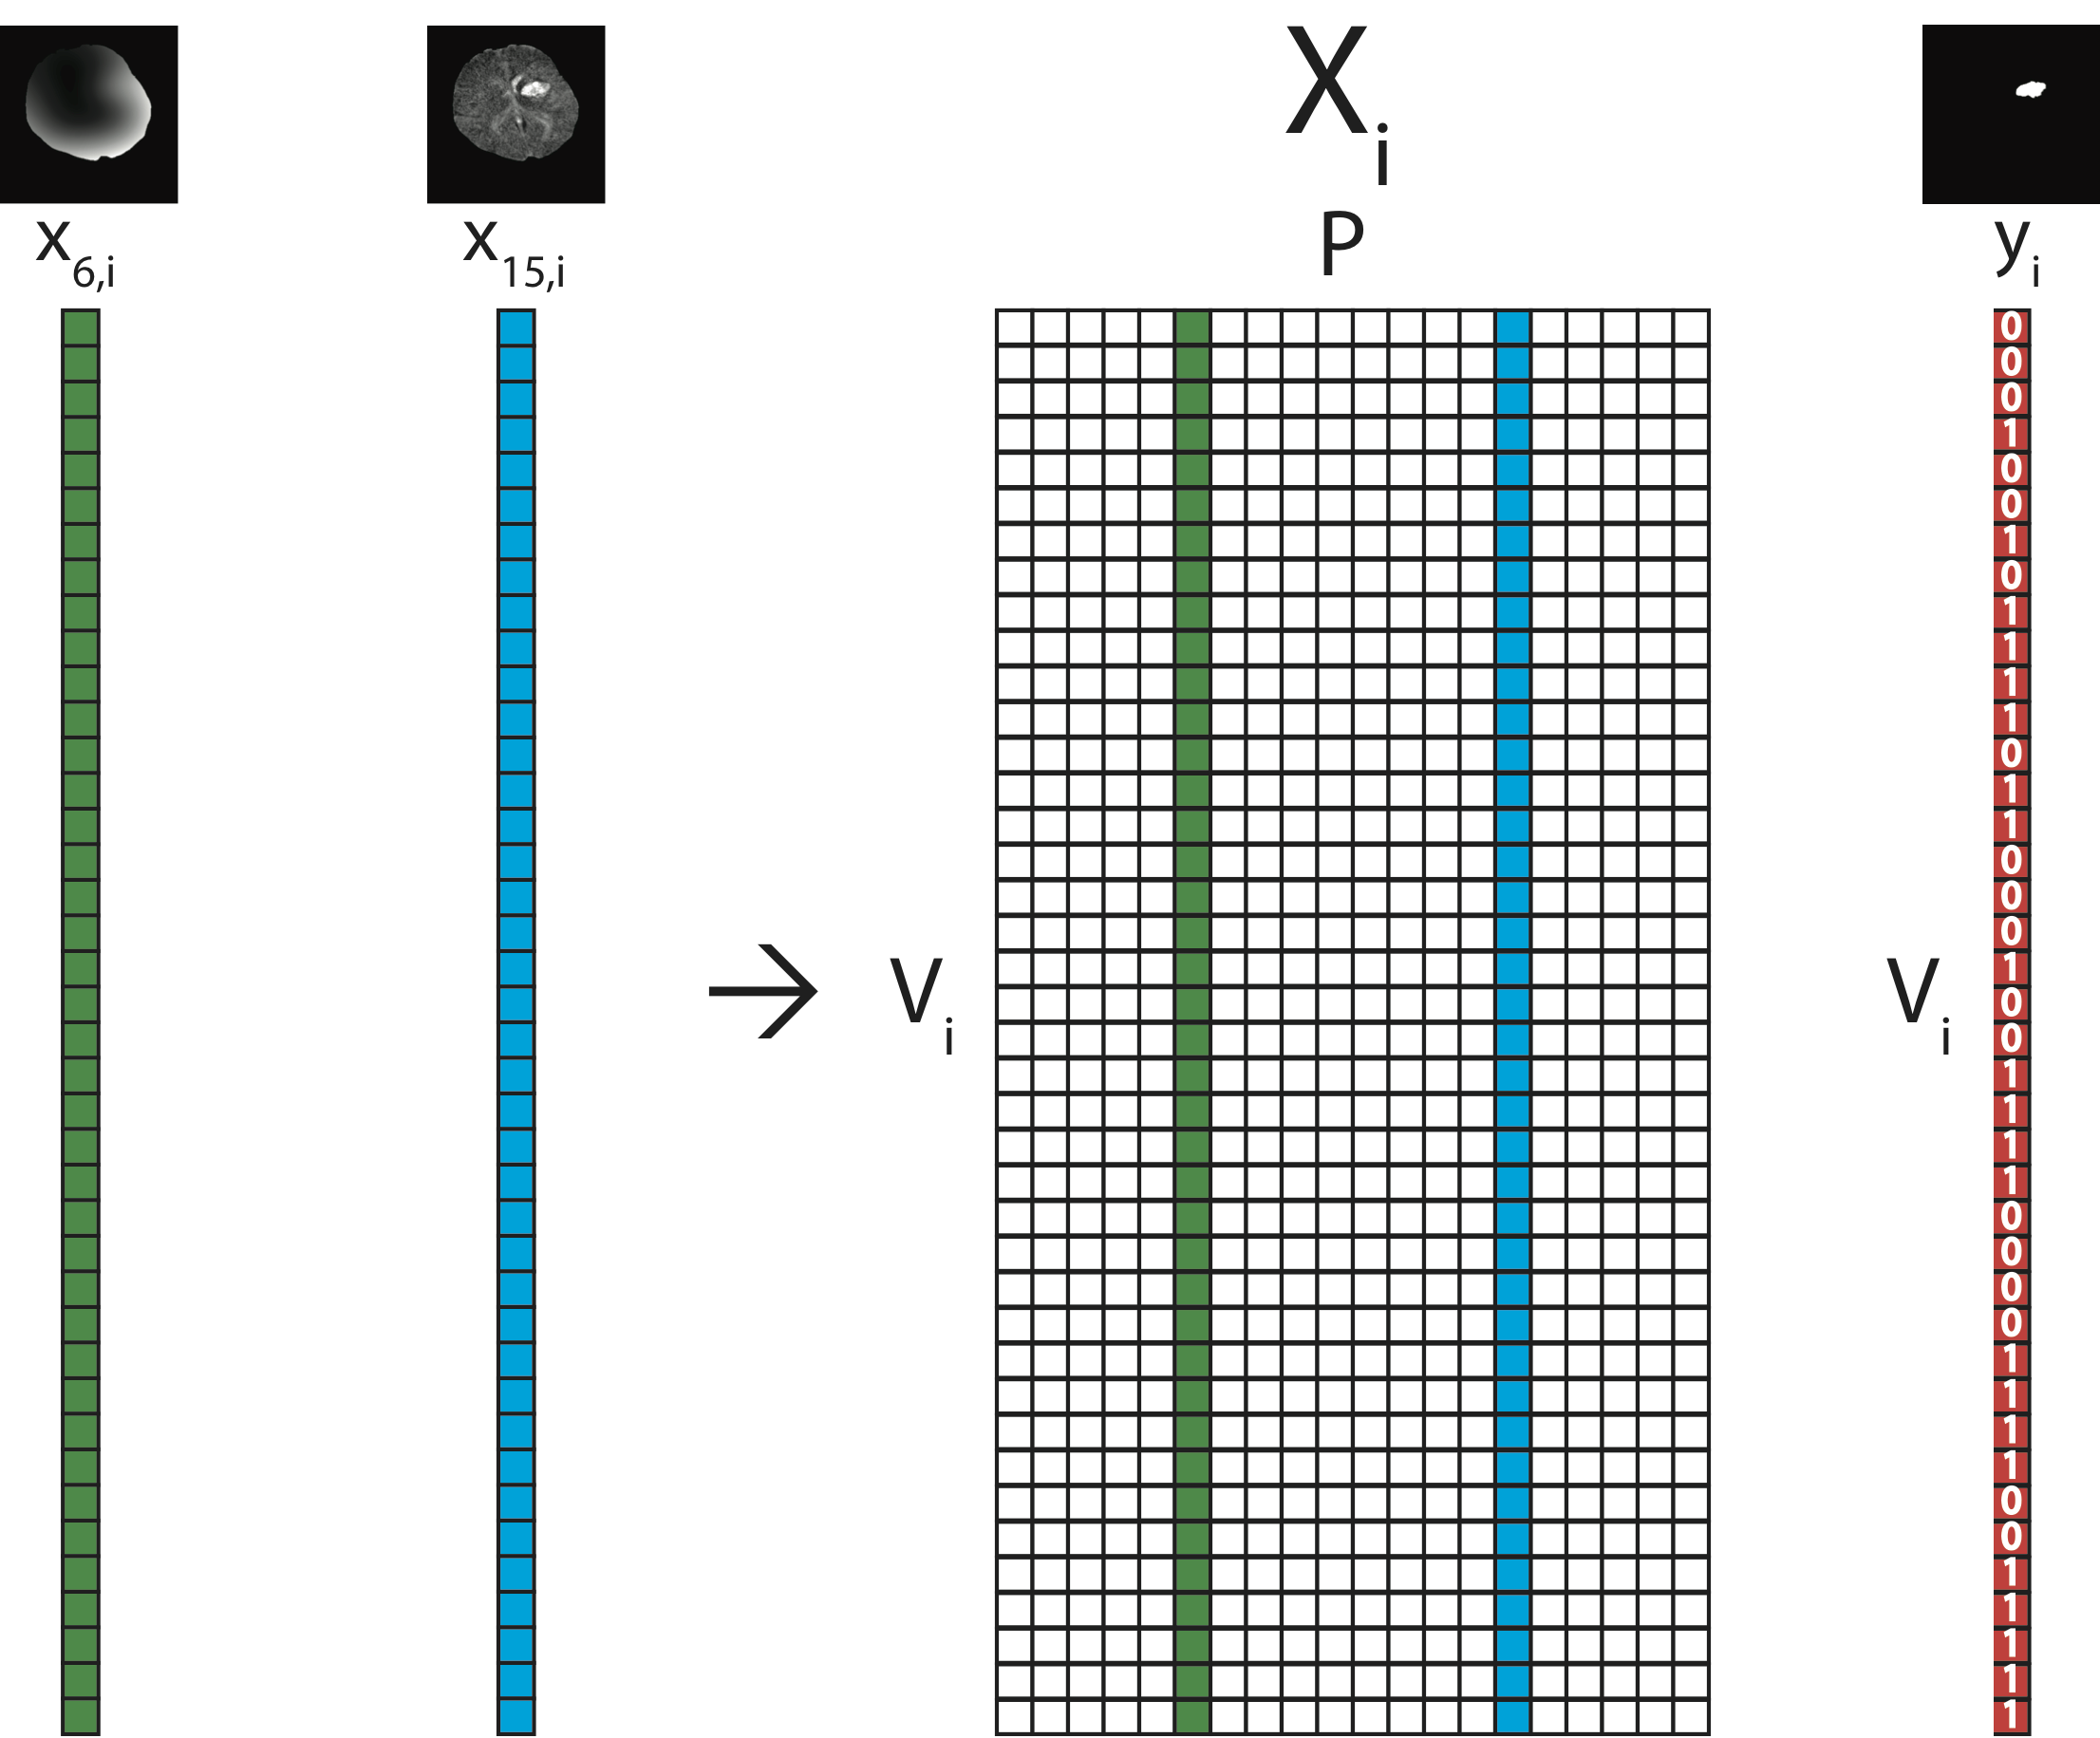
Training Data Structure
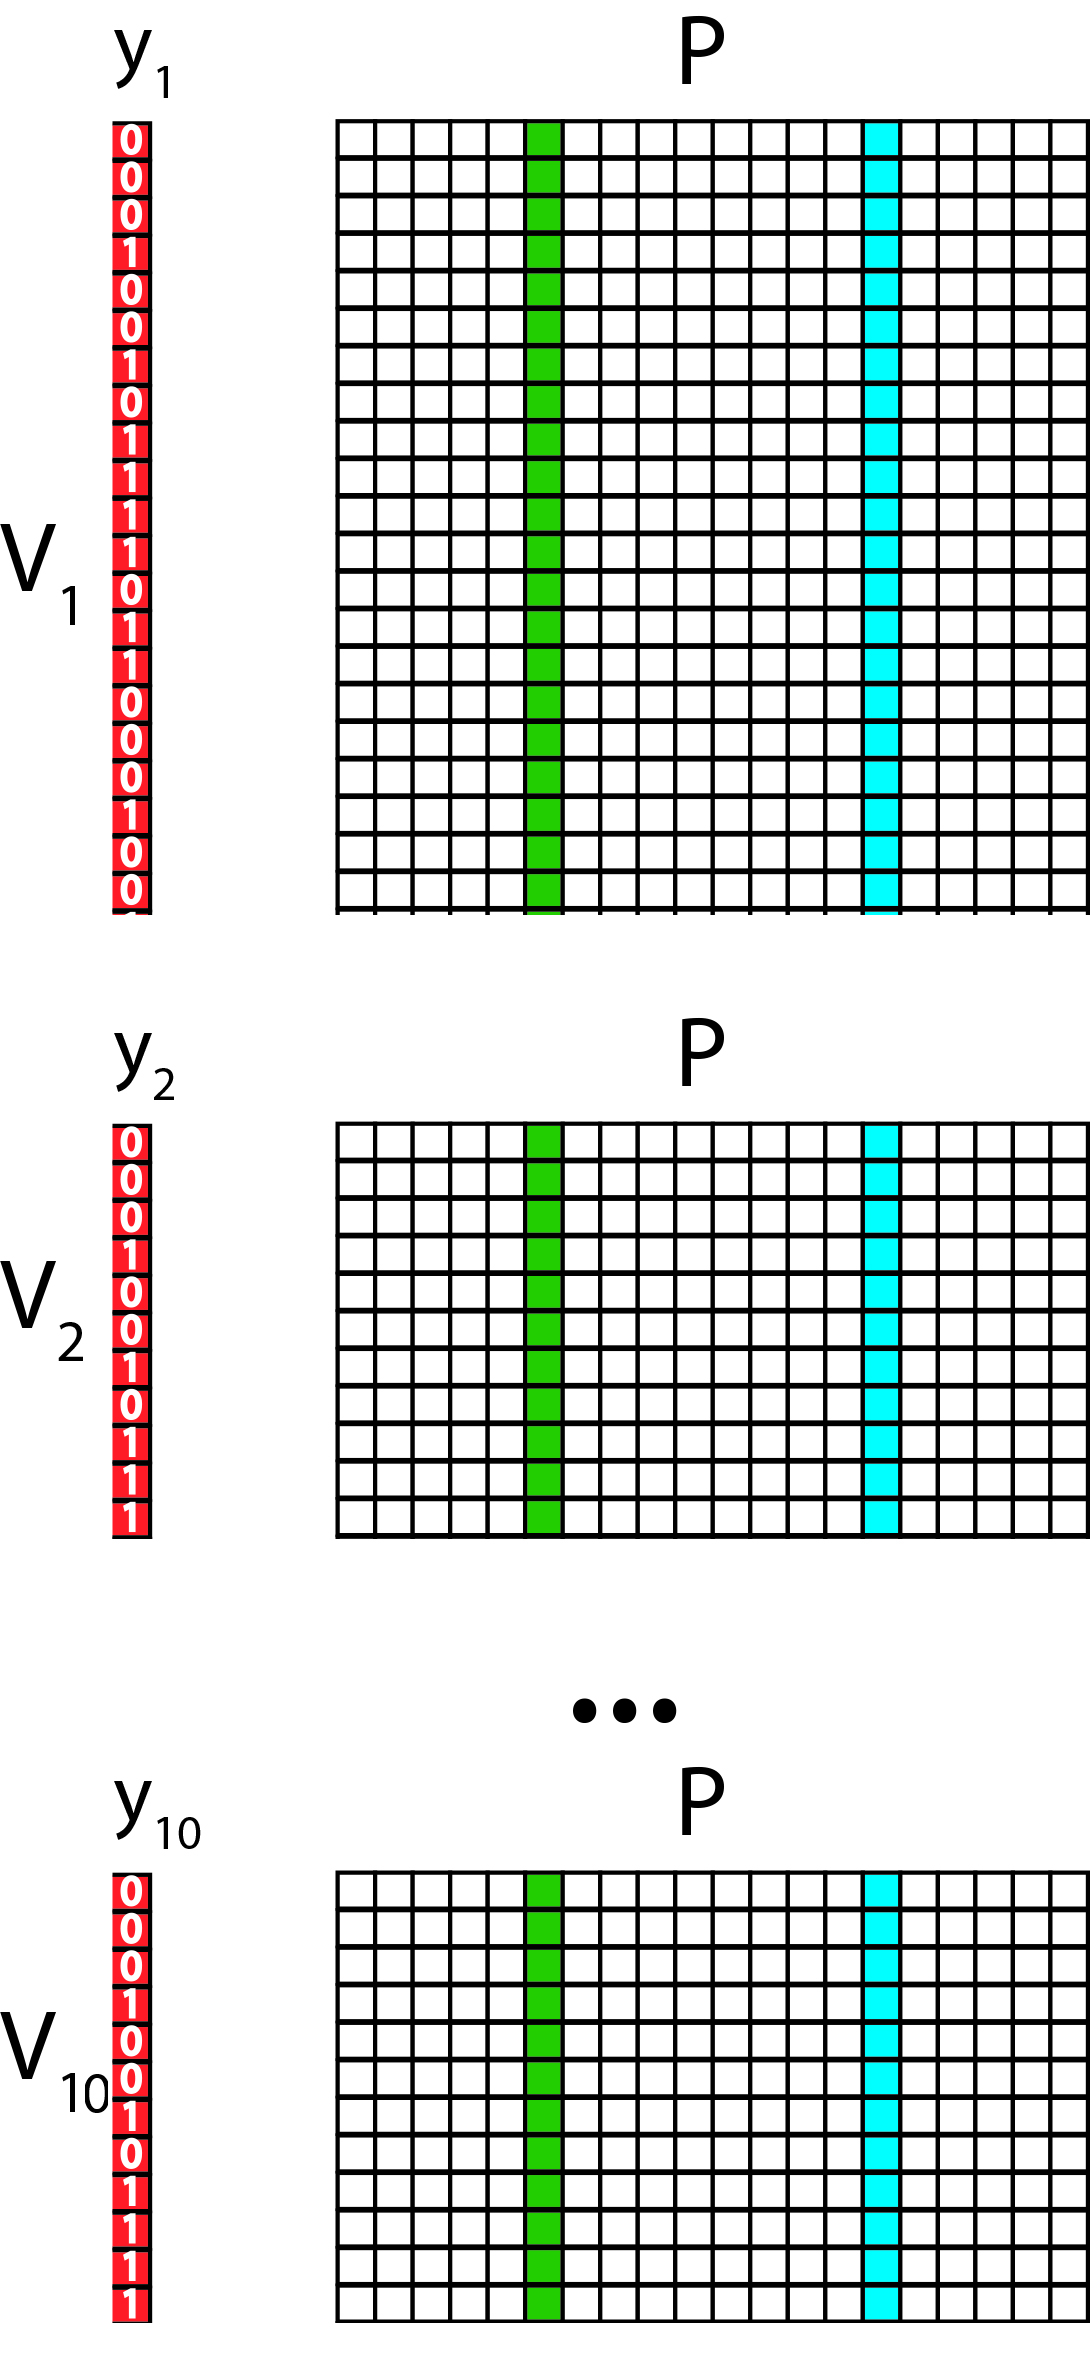
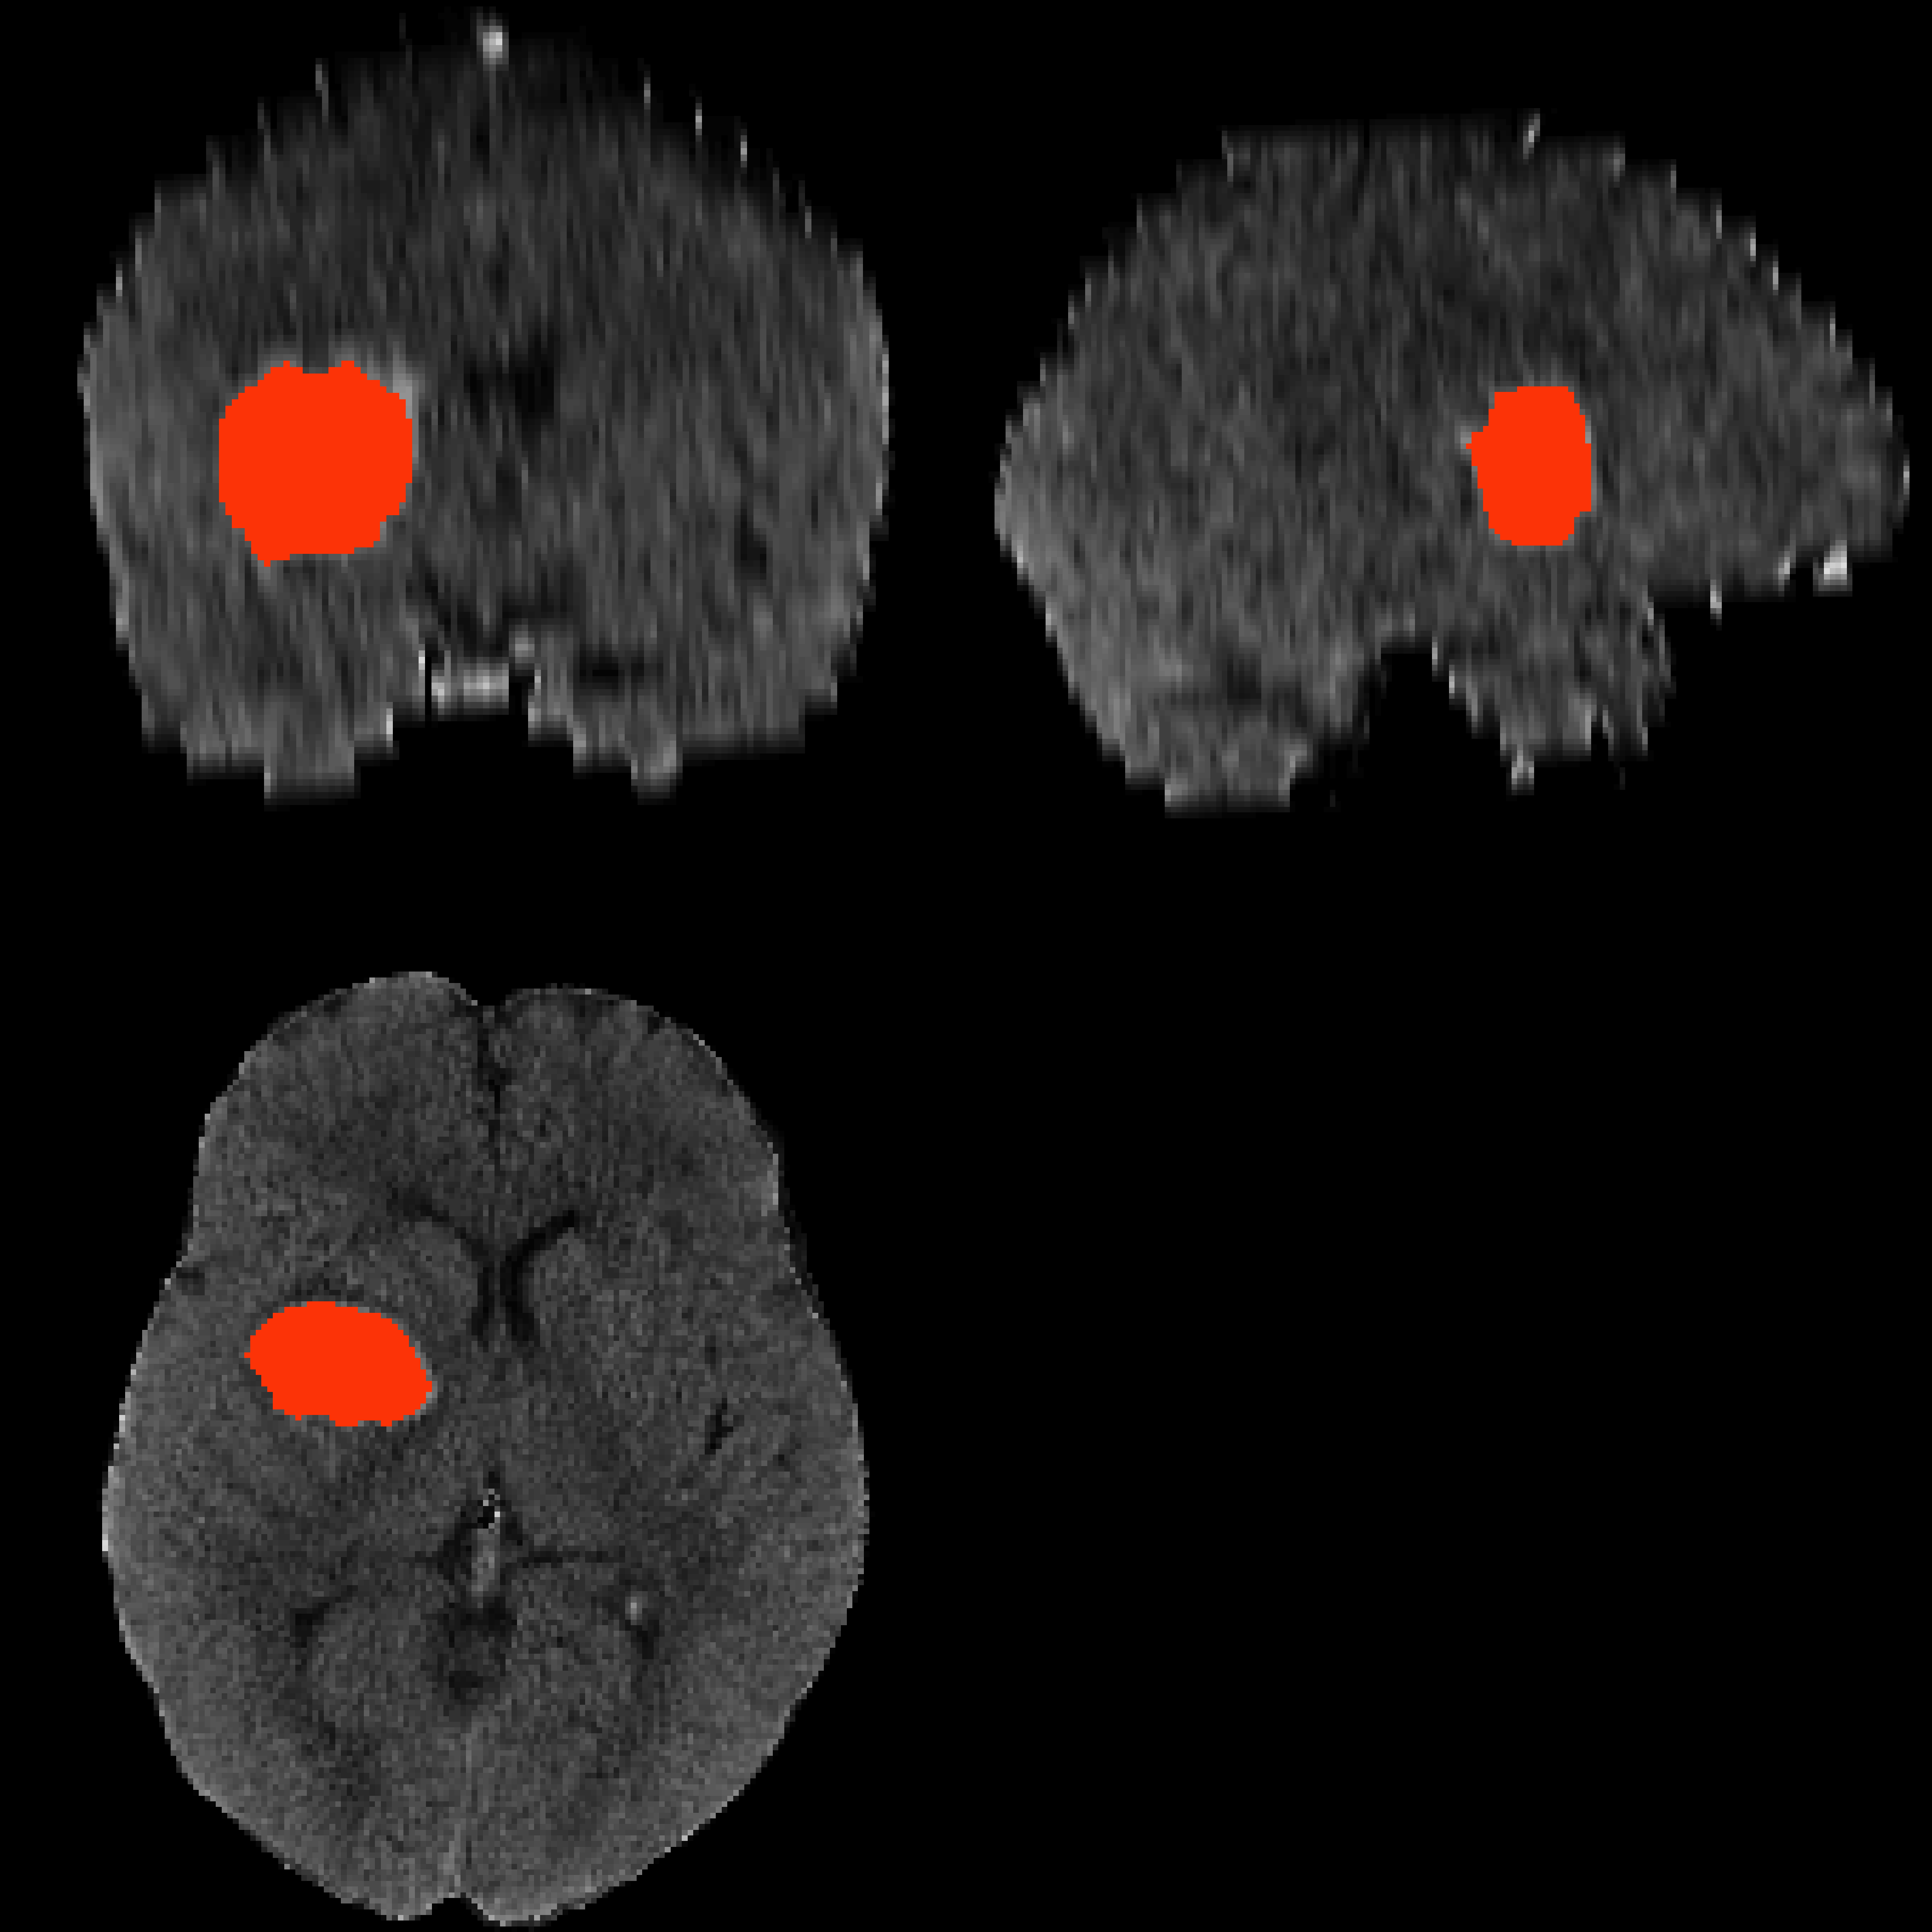
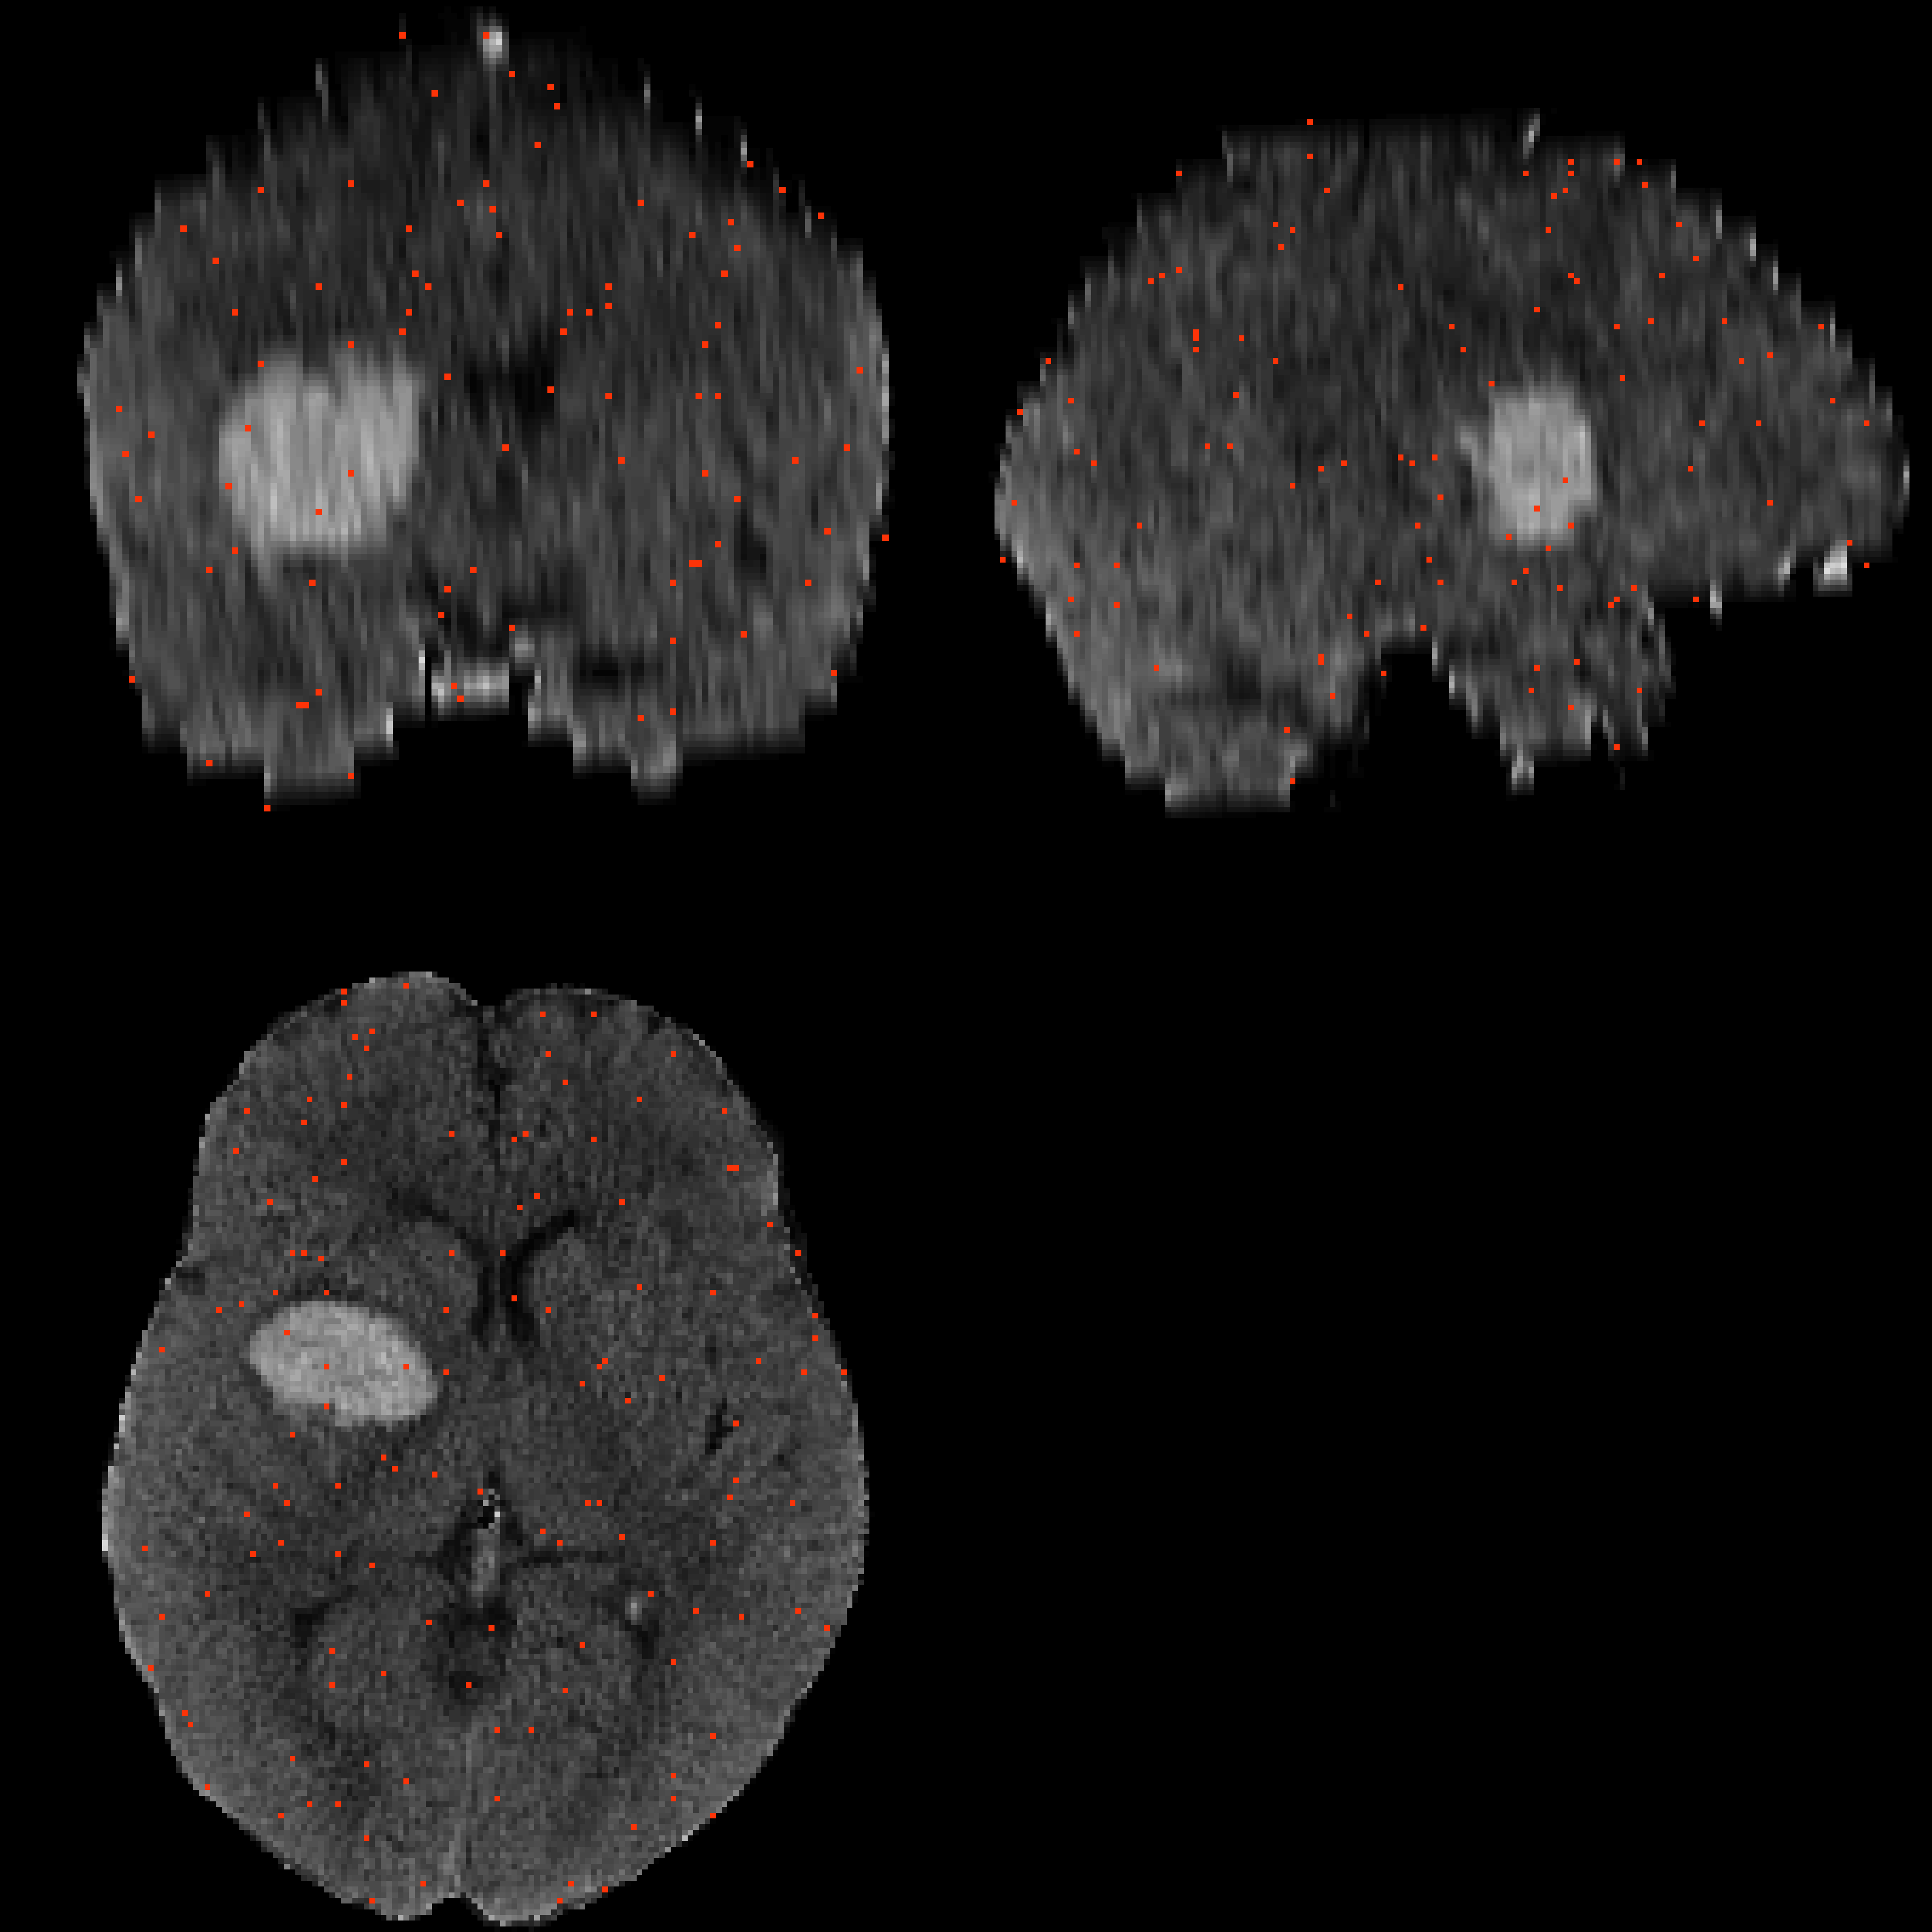
Again, \(y_{i}(v)\) is the presence / absence of ICH for voxel \(v\) from person \(i\).
General model form: \[ P\{y_{i}(v) = 1\} \propto f\{X_{i}(v)\} \]
All models fit in R.
glm function)mgcv package)glmnet package): \[ \mathcal{L}\left[\left.Y_{i}(v) \right|\, f\{X_i(v)\}\right] \propto \beta_0 + \sum_{k= 1}^{p} x_{i, k}(v) \beta_{k} + \lambda \sum_{k= 1}^{p} \left|\beta_{k}\right|
\]randomForest package)
\(f(X_{i}(v)) \propto\) 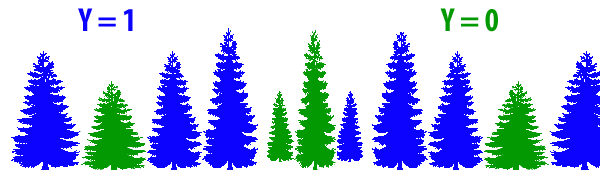
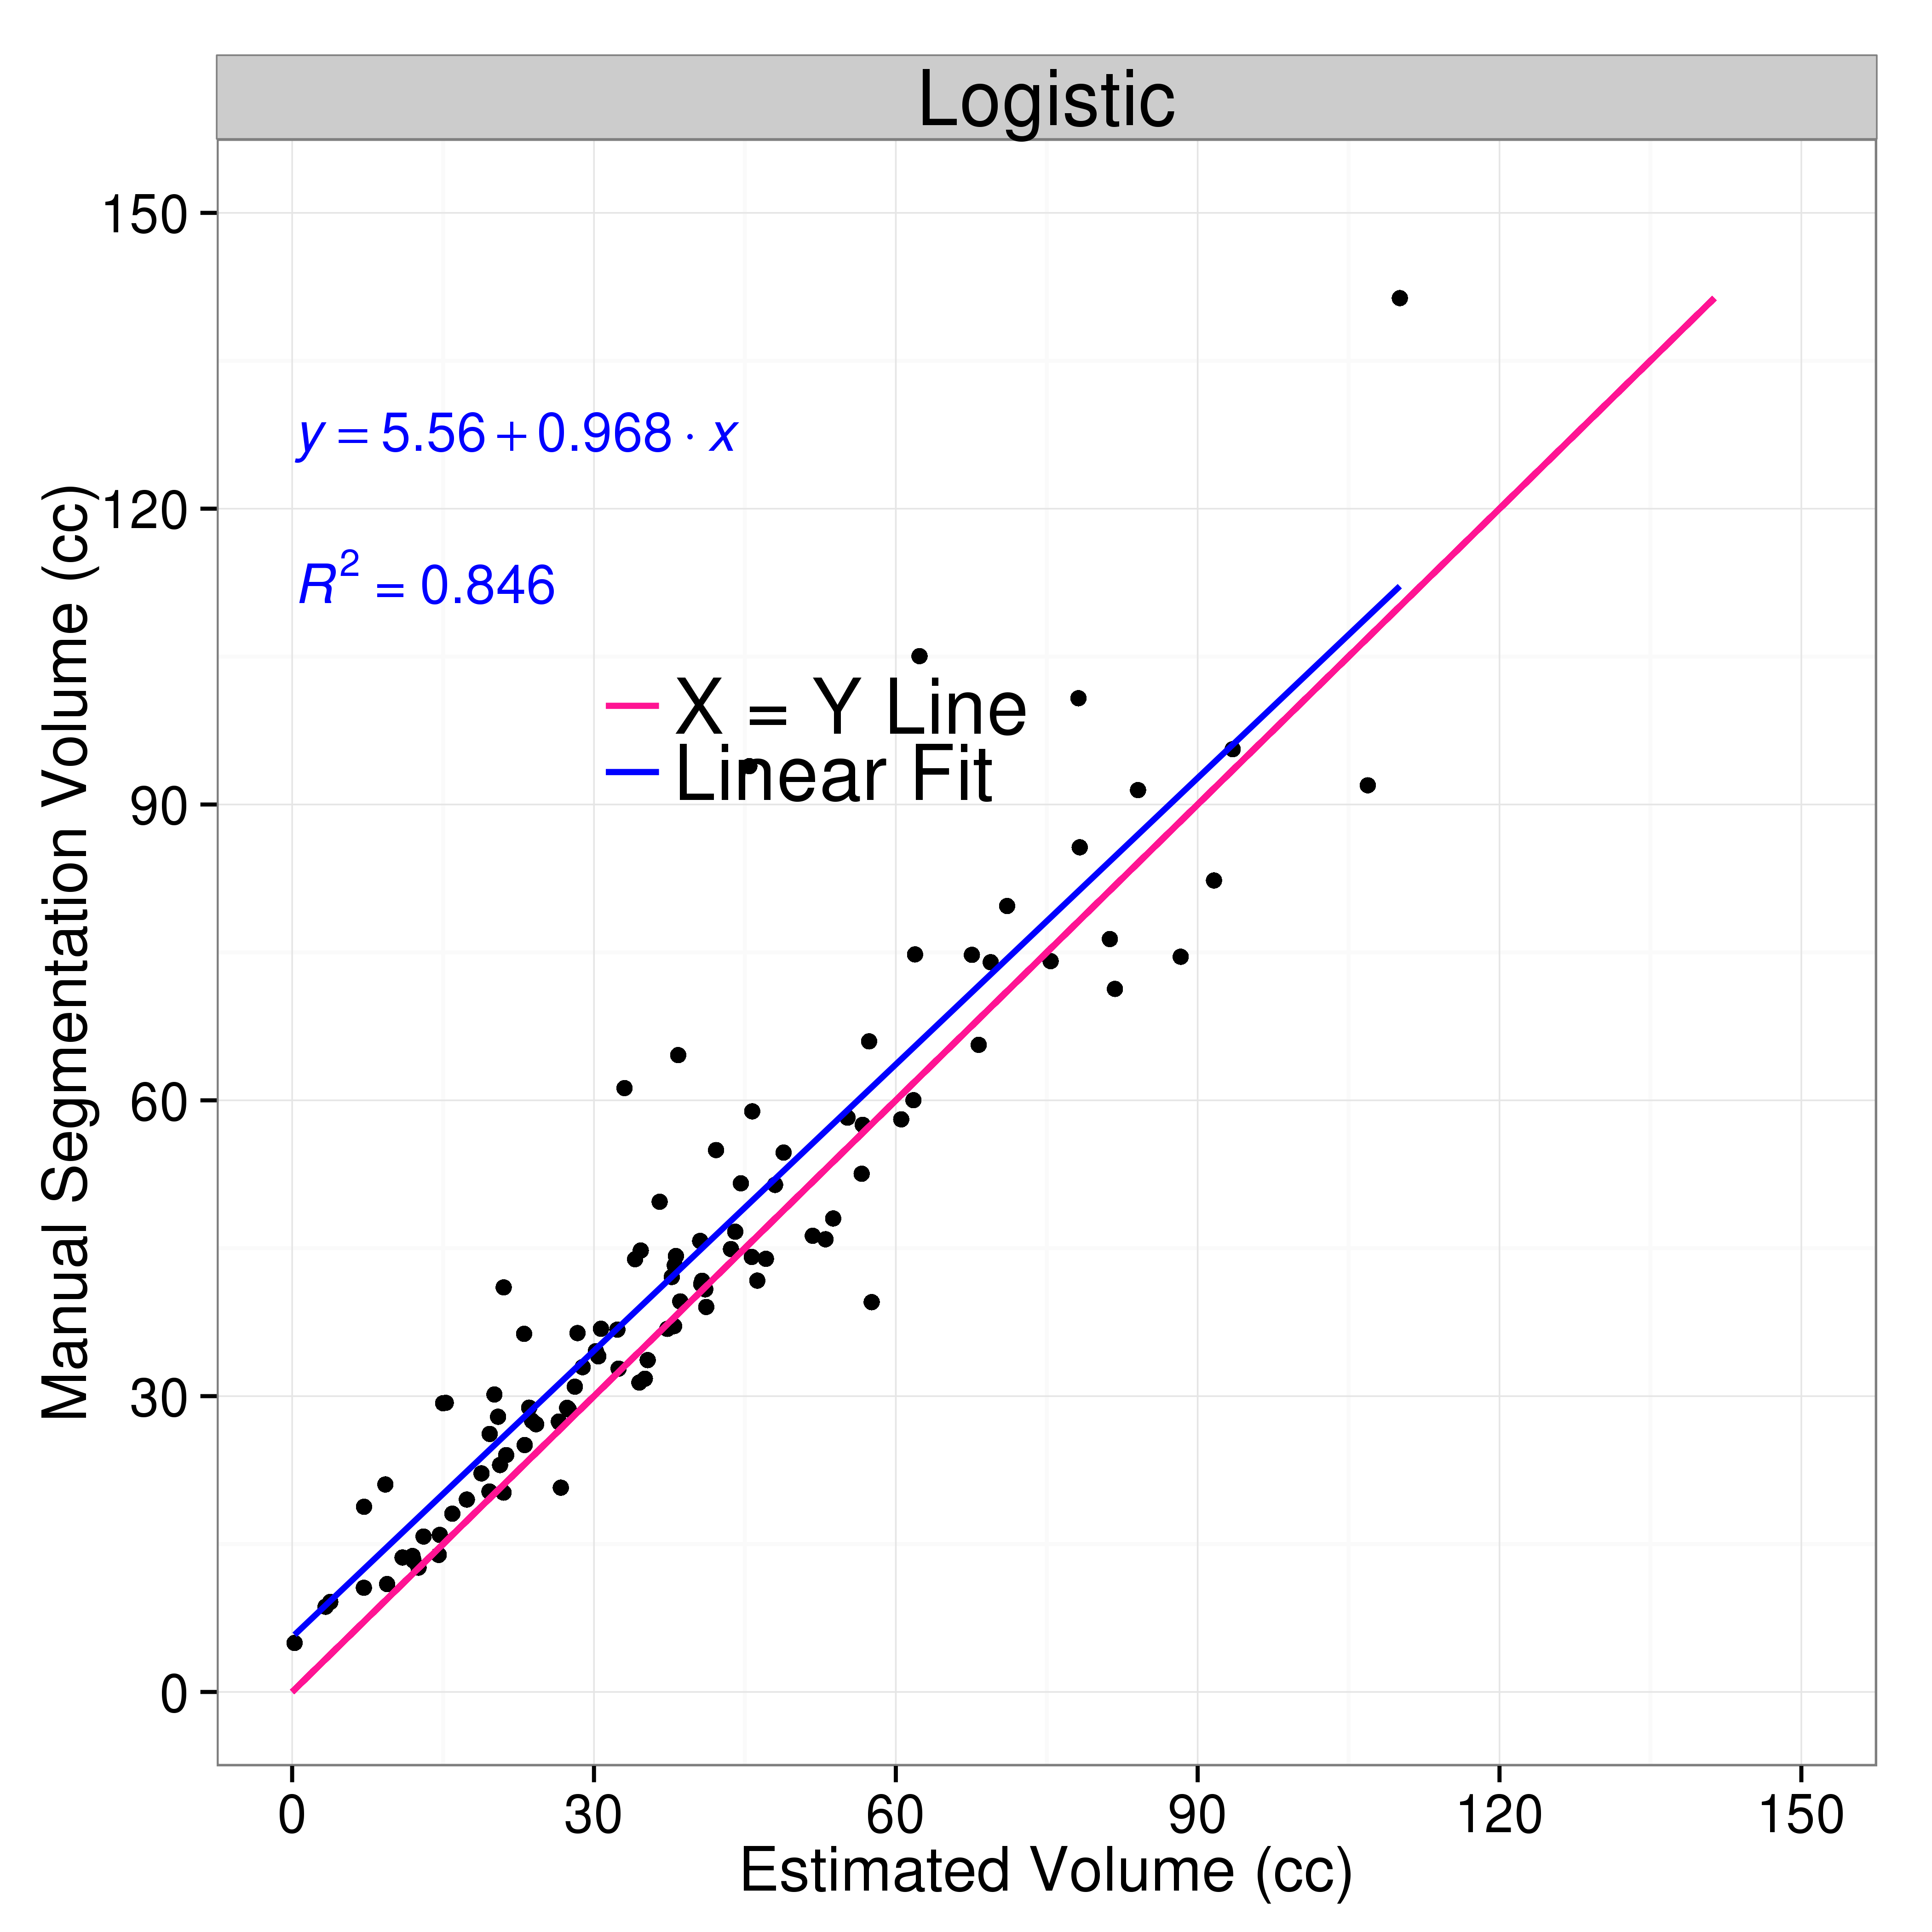
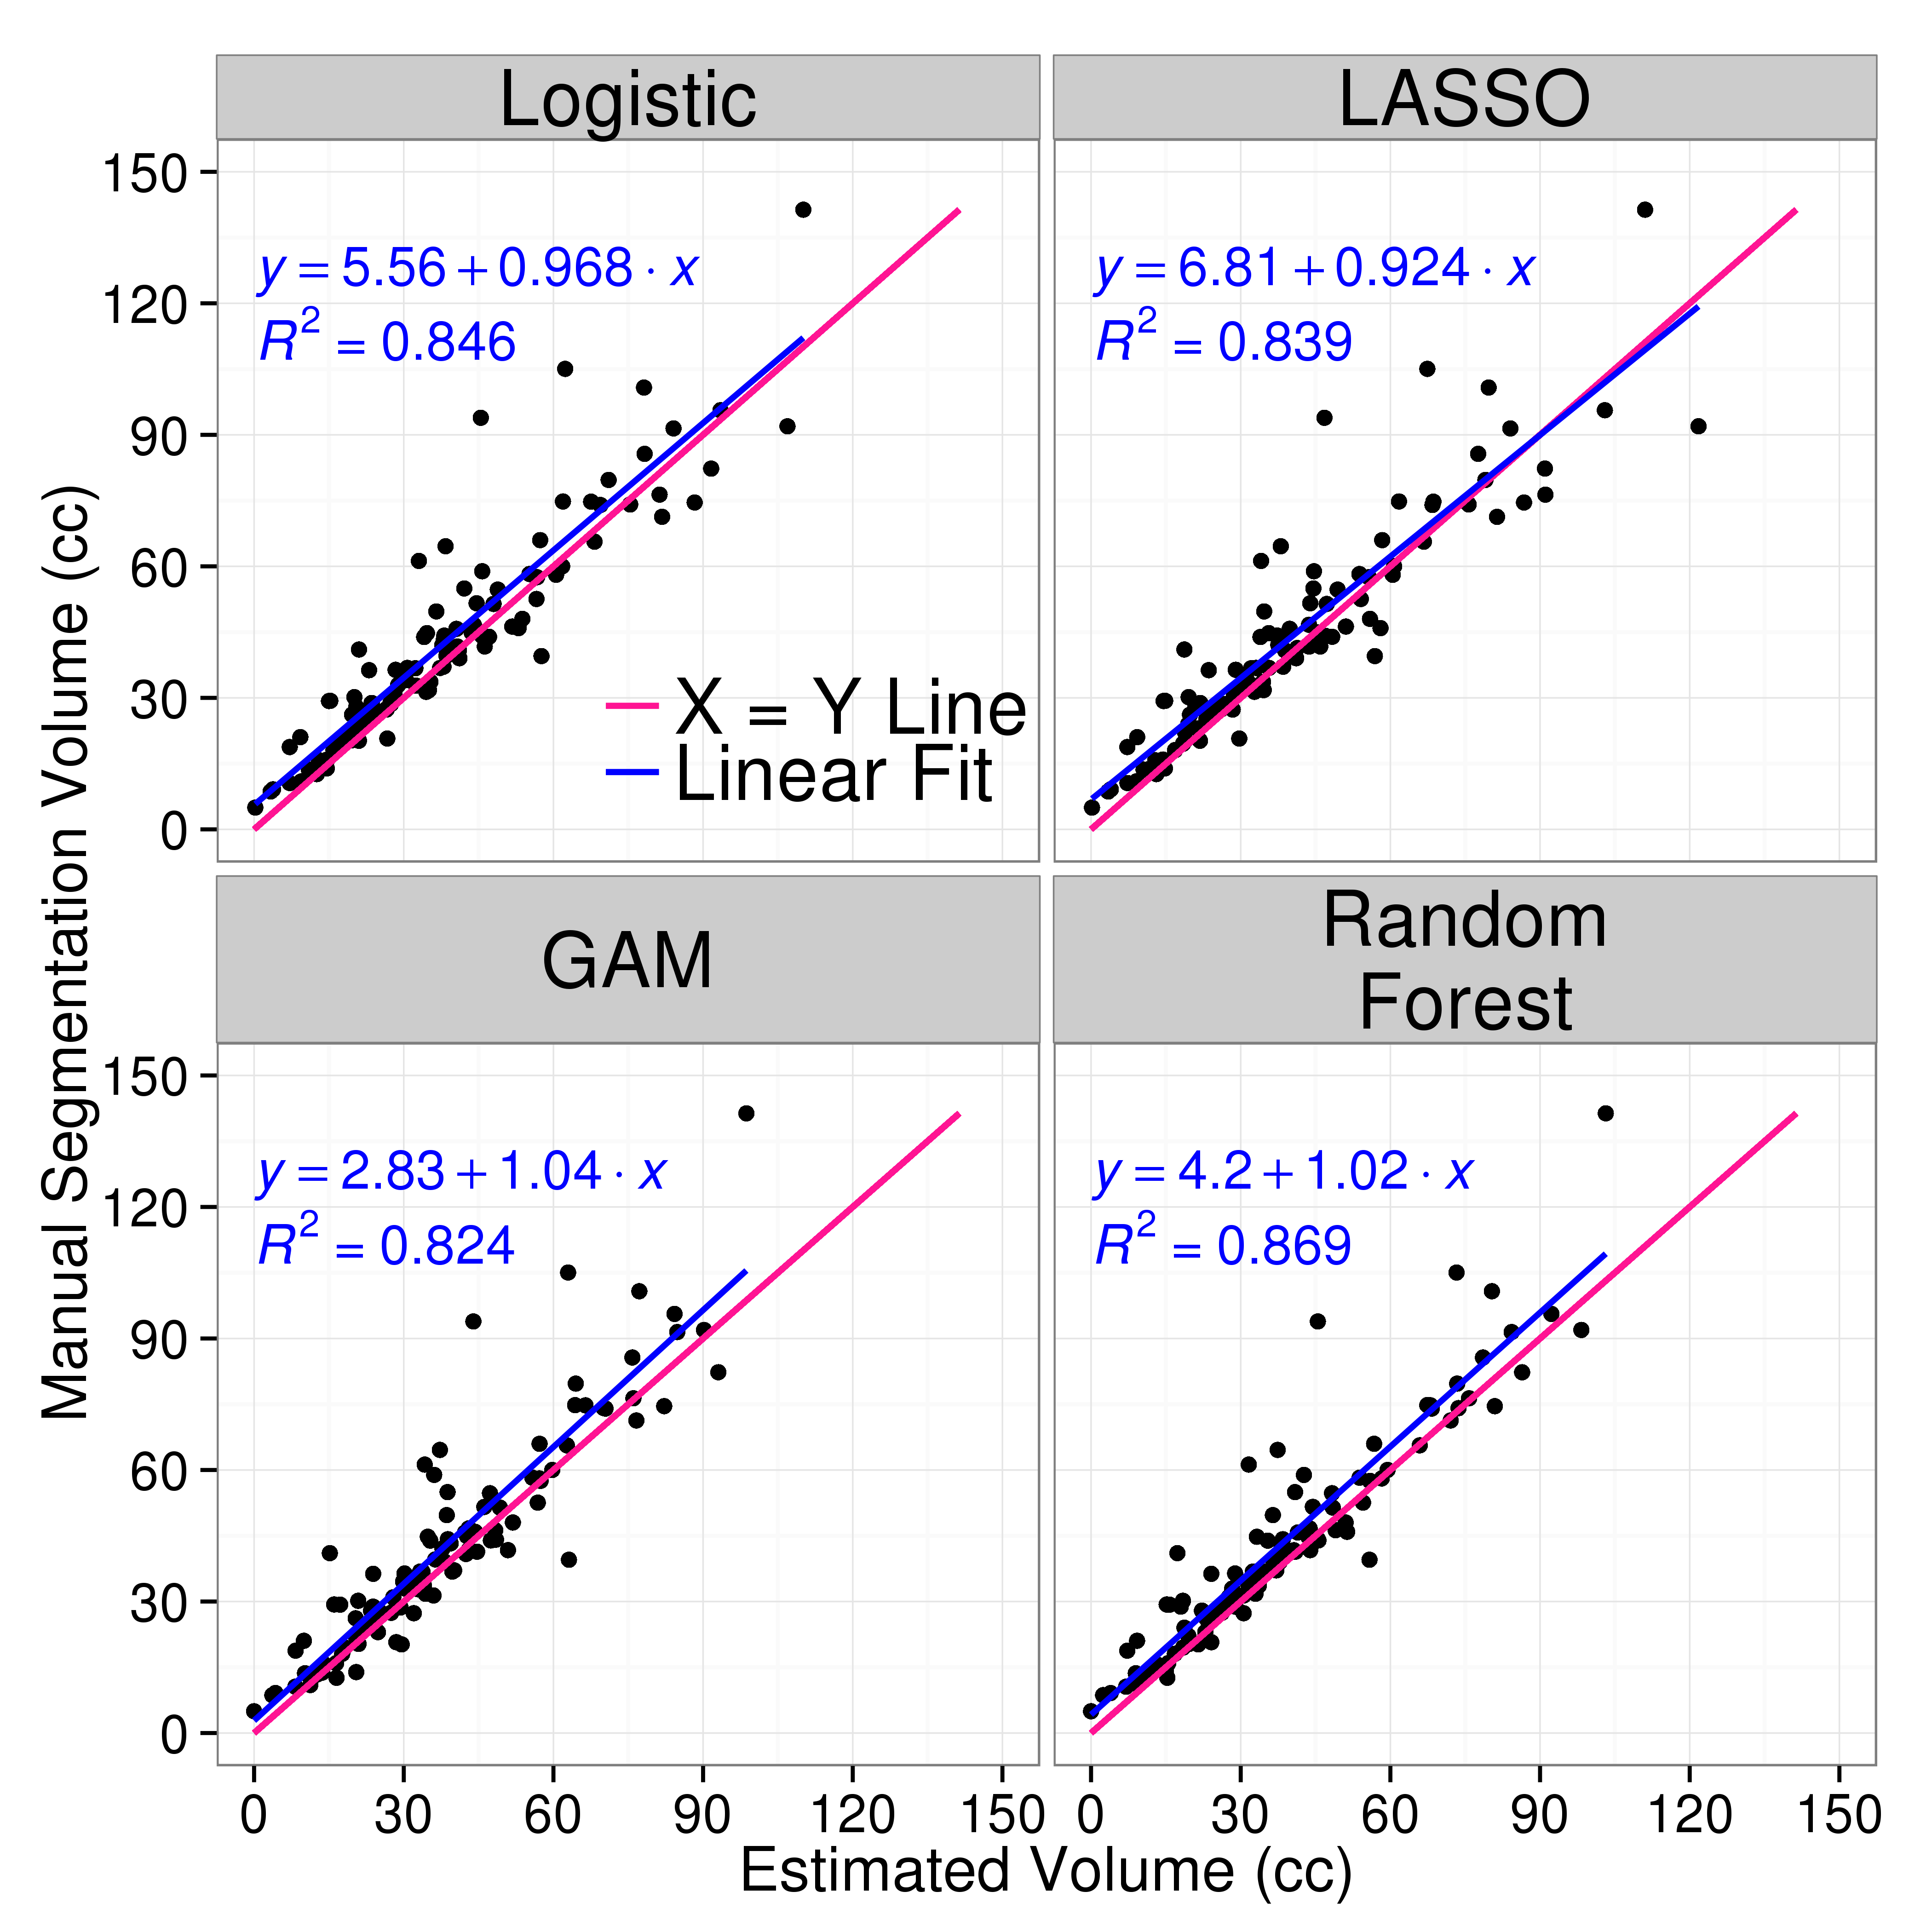
\[ \text{Estimated Volume}_{i} = \text{cc per voxel} \times \sum_{v}^{V_i} \hat{y}_{i}(v) \]
\[ \text{Volume}_{i} = \text{cc per voxel} \times \sum_{v}^{V_i} y_{i}(v) \]
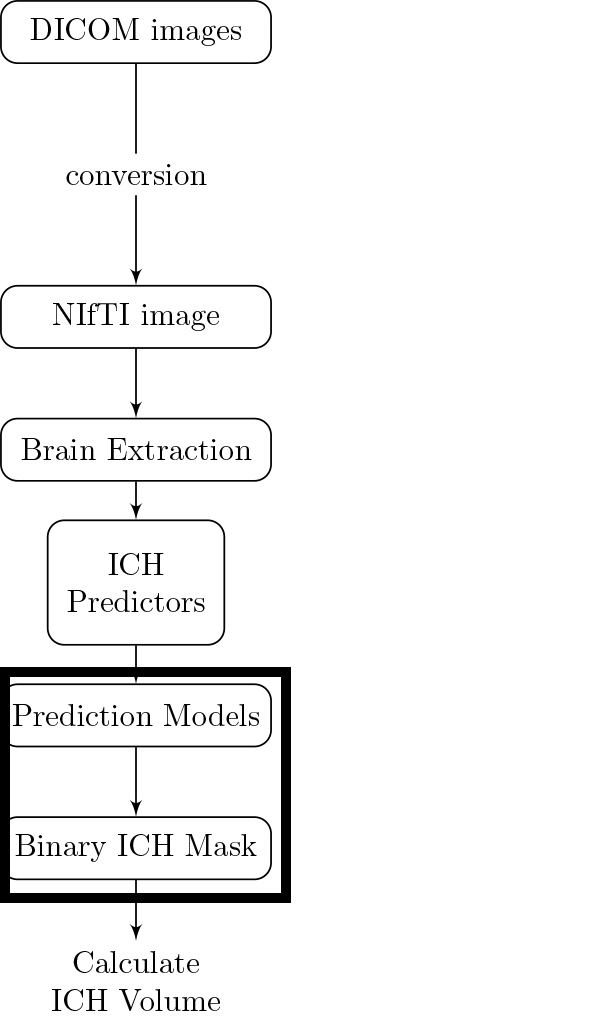
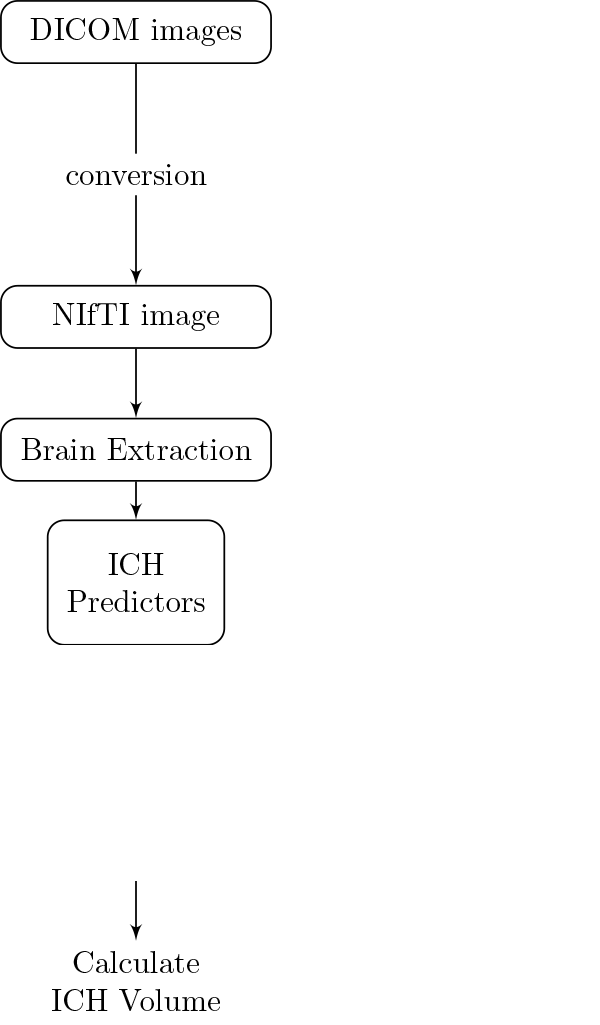
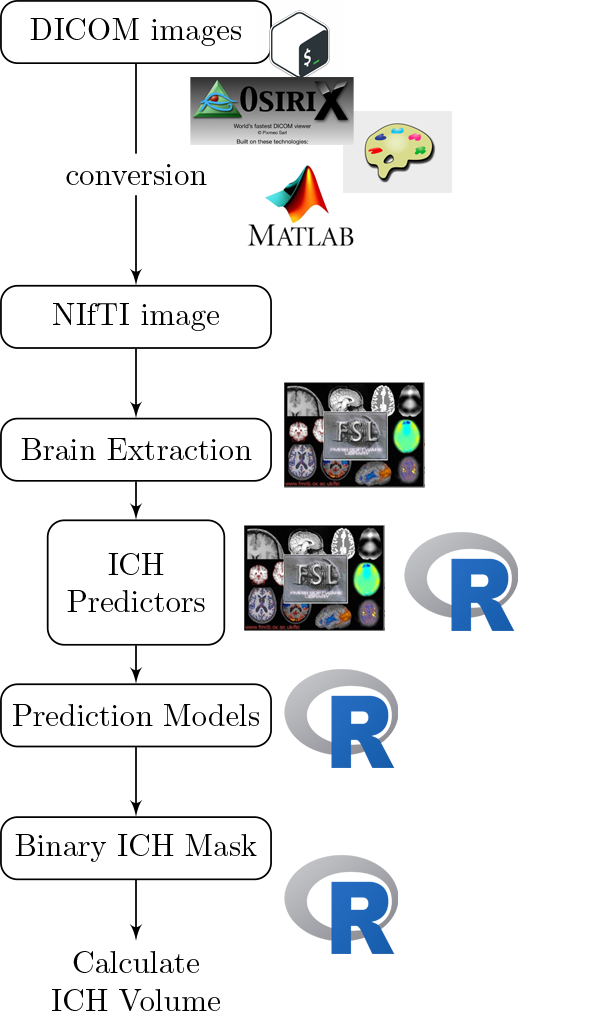
Multiple pieces of software used
 Neuroconductor:
Lower the bar to entry
Complete pipeline
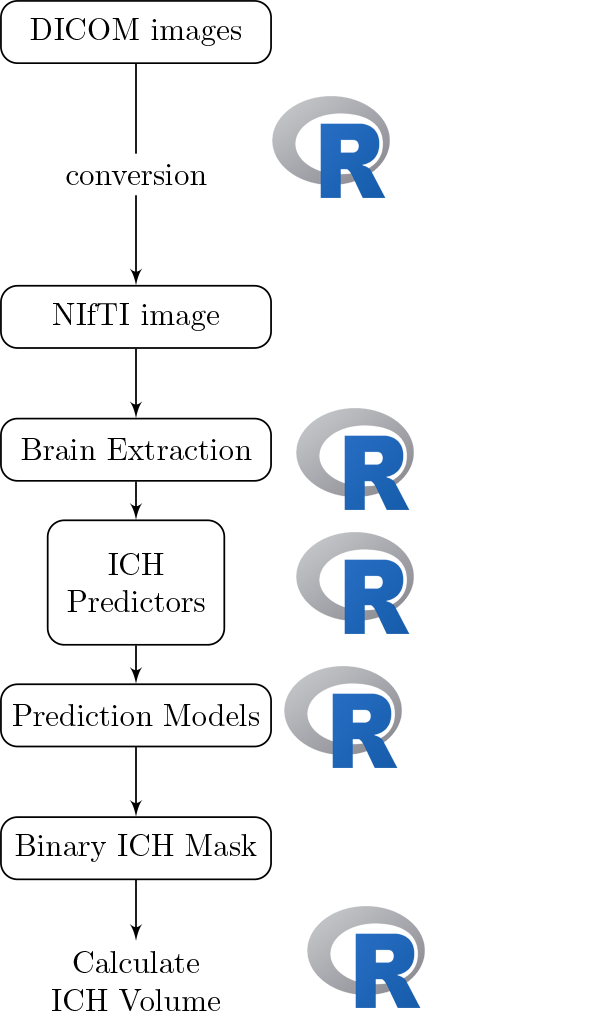
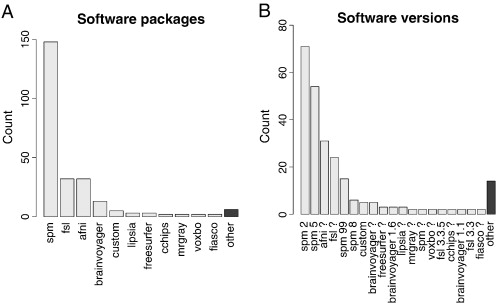
From Carp, Joshua. "The secret lives of experiments: methods reporting in the fMRI literature." Neuroimage 63.1 (2012): 289-300.
Number of downloads as of January 18, 2017 (cranlogs package):
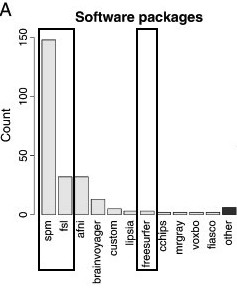
Centralize the packages
Detailed tutorials on how to actually perform an analysis
Provide package checks / rules / stability



Allow neuroimaging to use all R has to offer:
Neuroconductor Downsides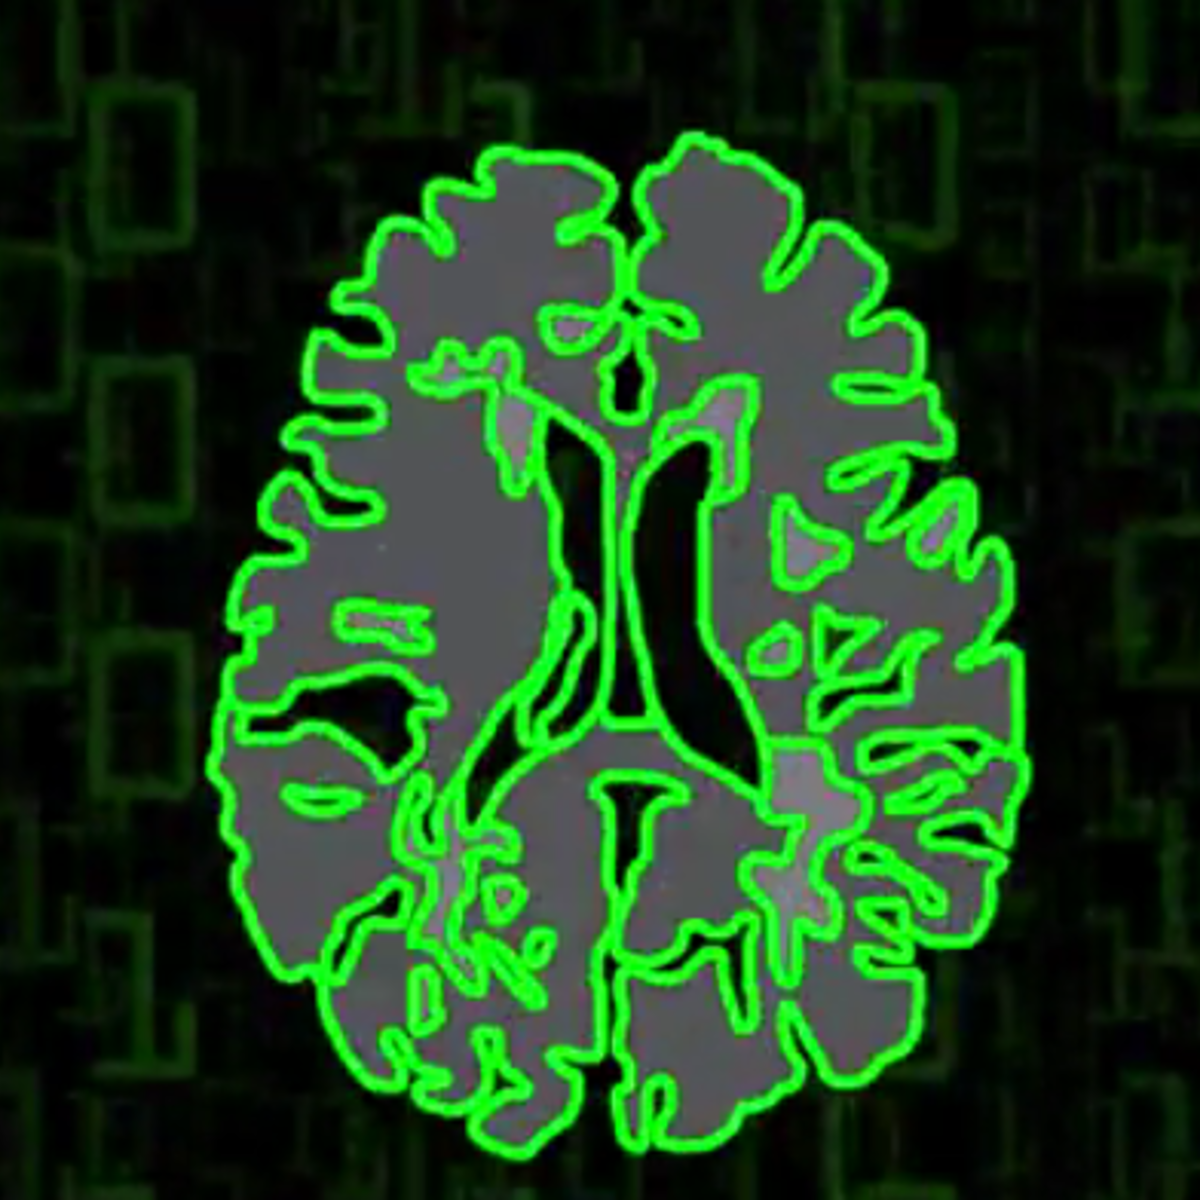
https://www.coursera.org/learn/neurohacking/
Short Course: Neuroimaging analysis within R (ISBI, Melbourne, April 2017)
Statistics in Imaging (Pittsburgh, May 2017)
Dan Hanley
Ciprian Crainiceanu 
Brian Caffo 
Jean-Philippe Fortin 
Adi Gherman 
Elizabeth Sweeney 
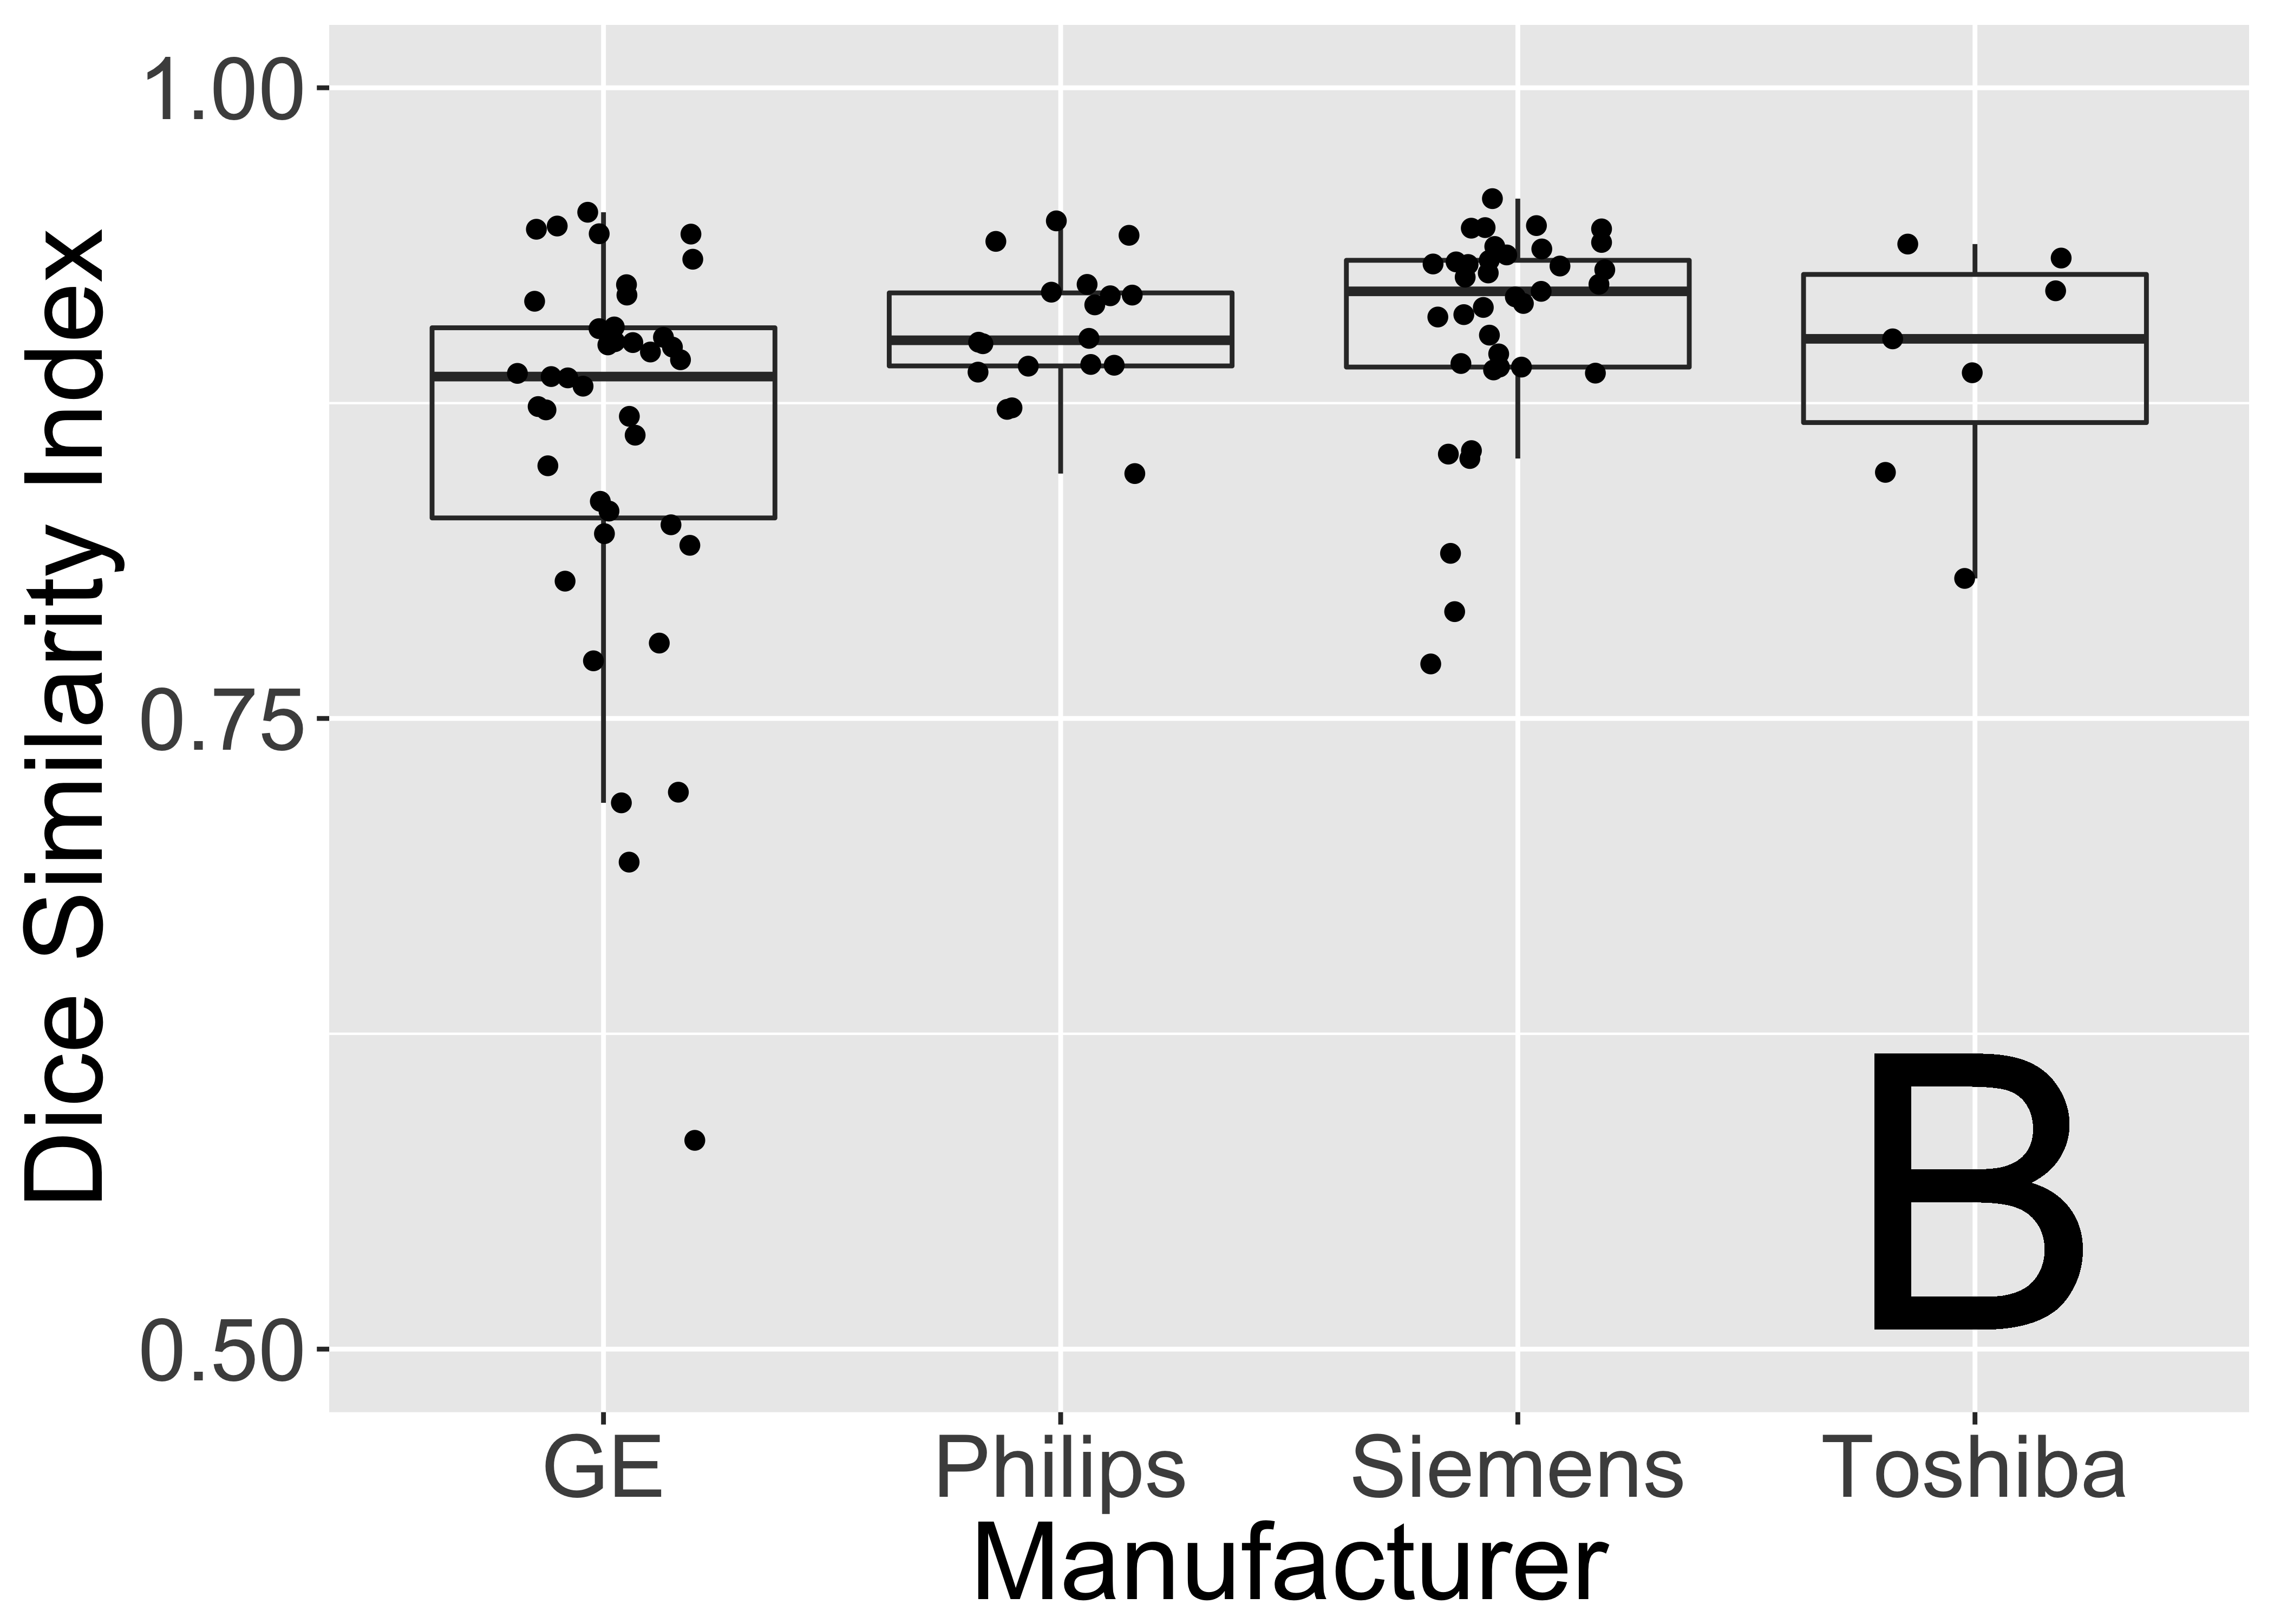
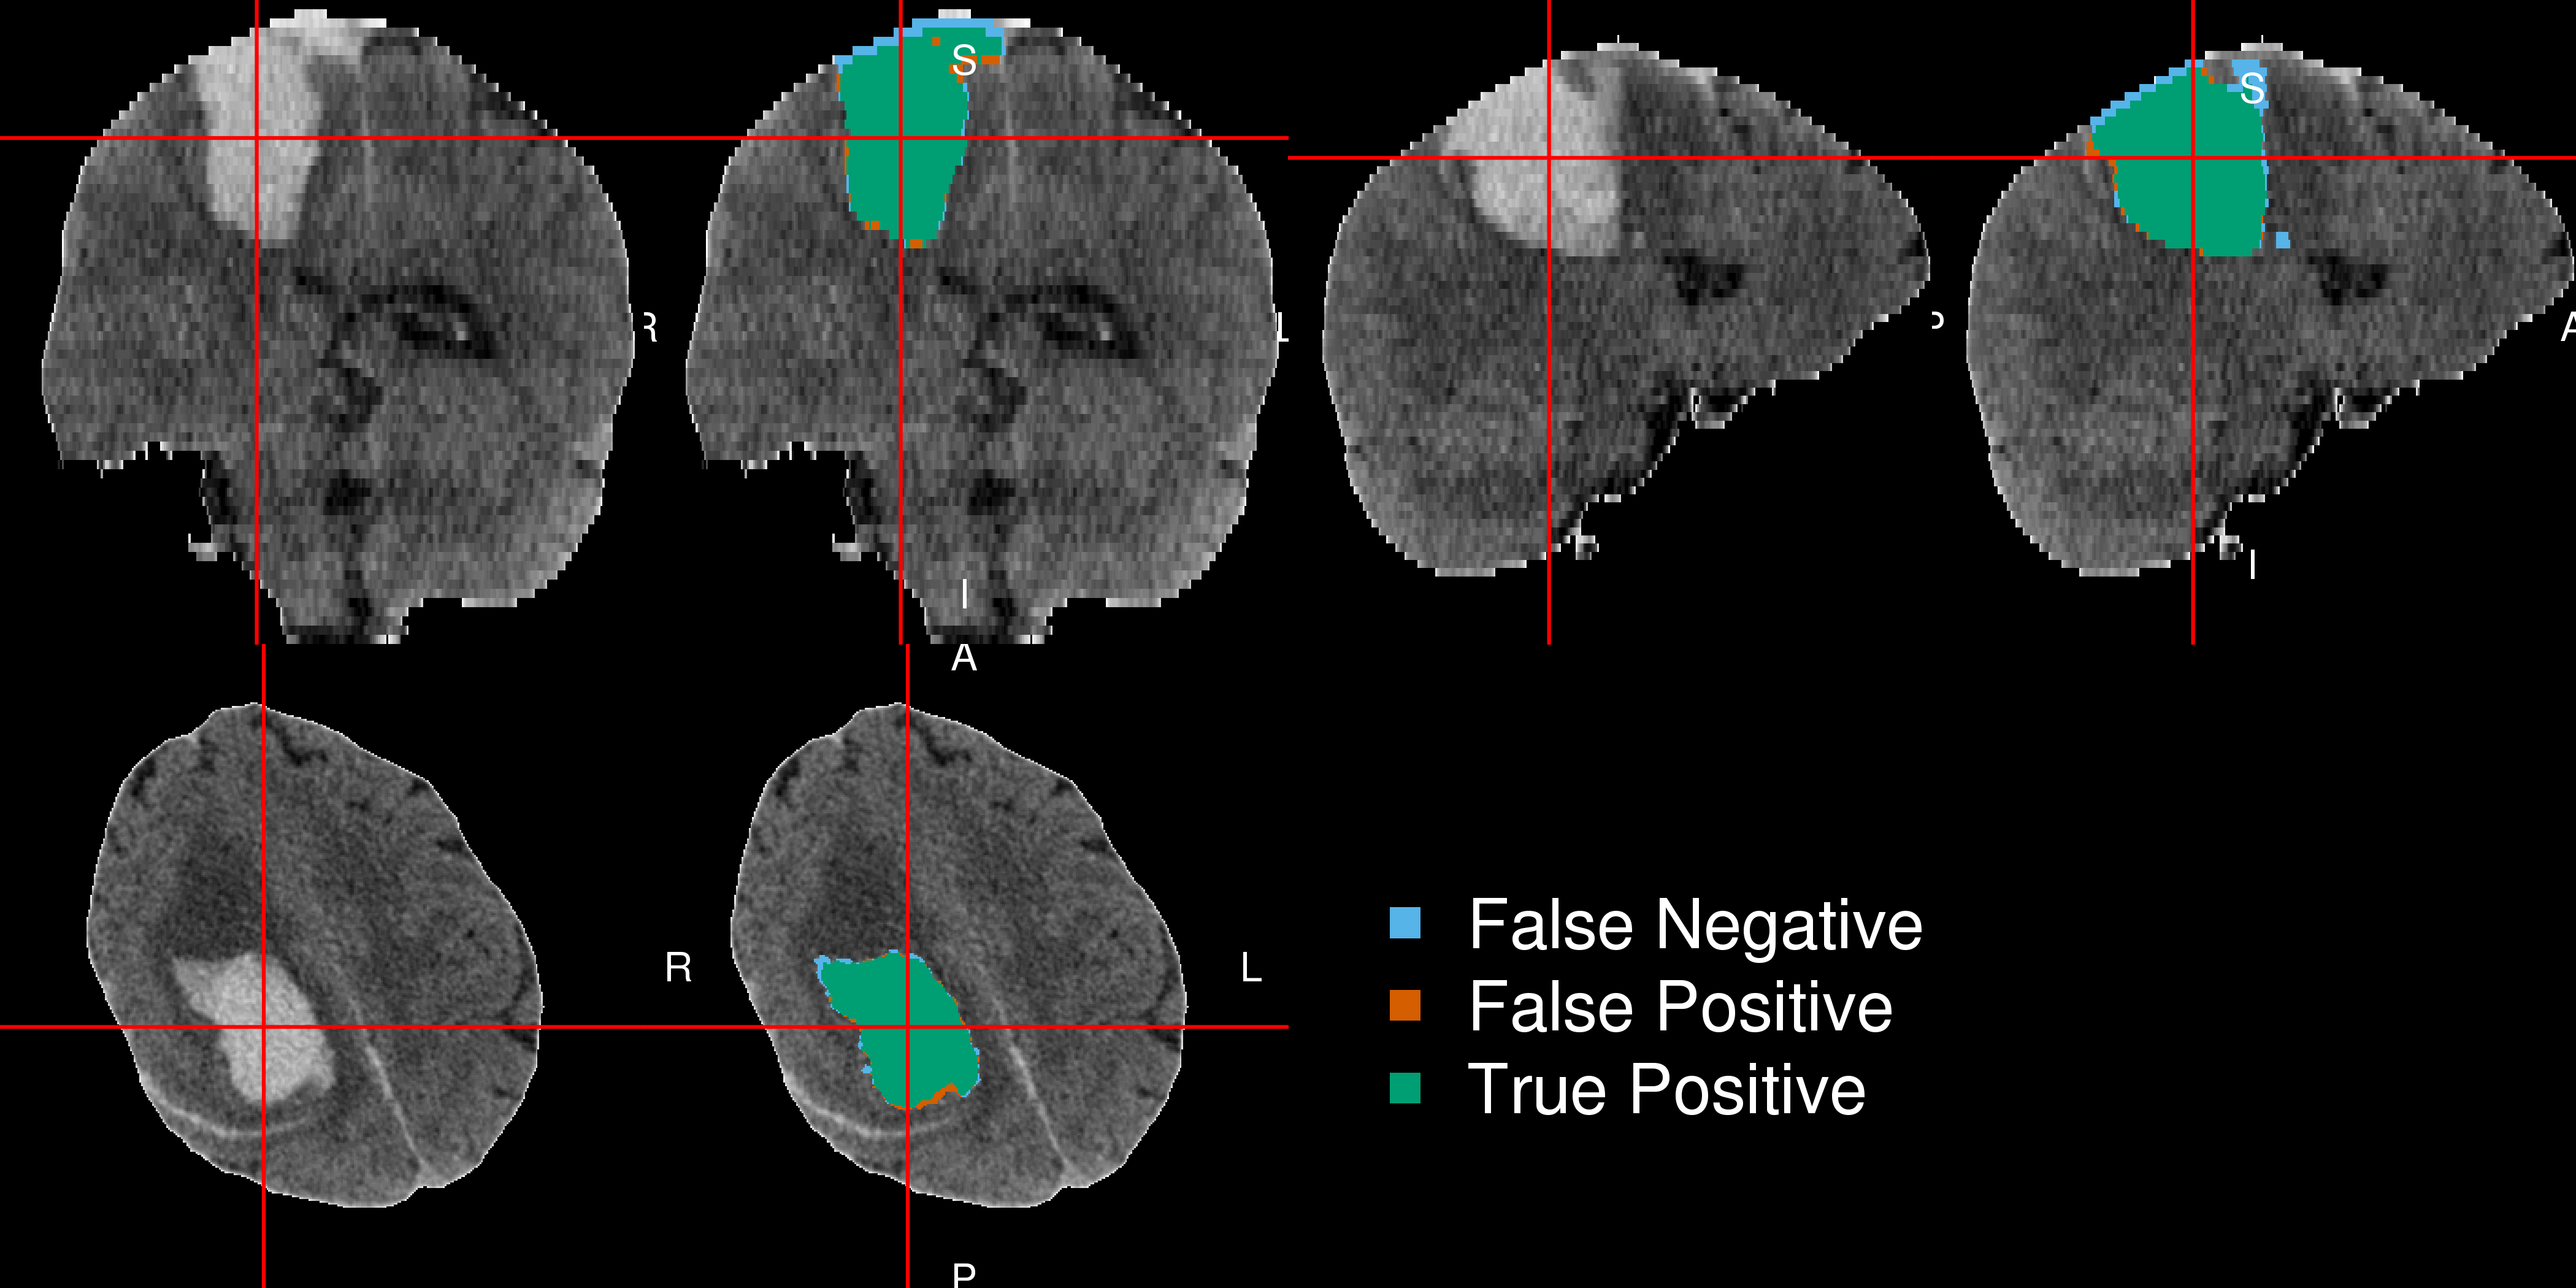
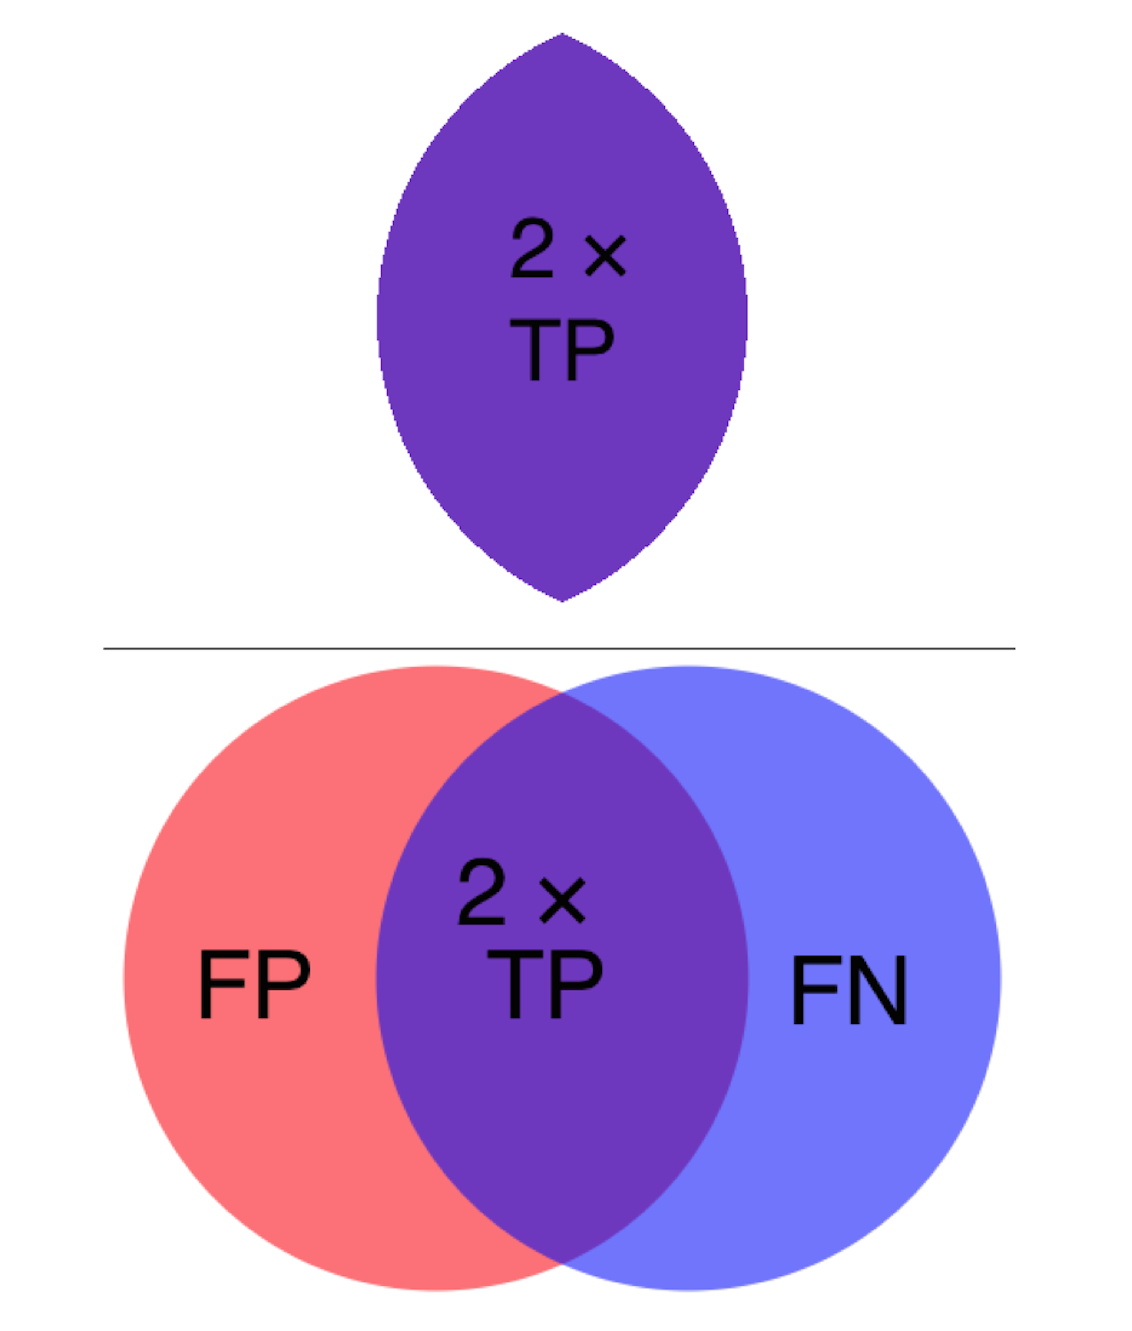
For each manual and automated segmentation, we can calculate the following 2-by-2 table, where the cells represent number of voxels and a corresponding Venn diagram:
| Manual | |||
| 0 | 1 | ||
| PitCH | 0 | TN | FN |
| 1 | FP | TP | |
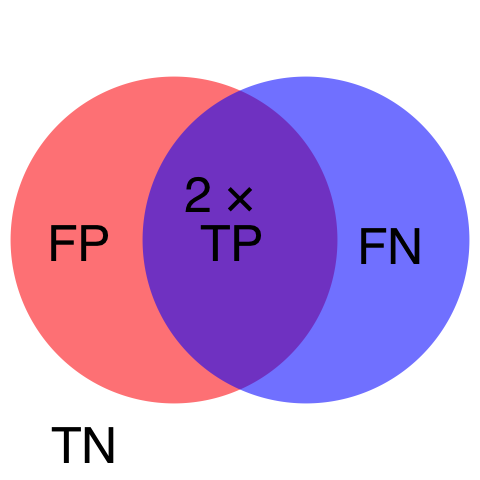
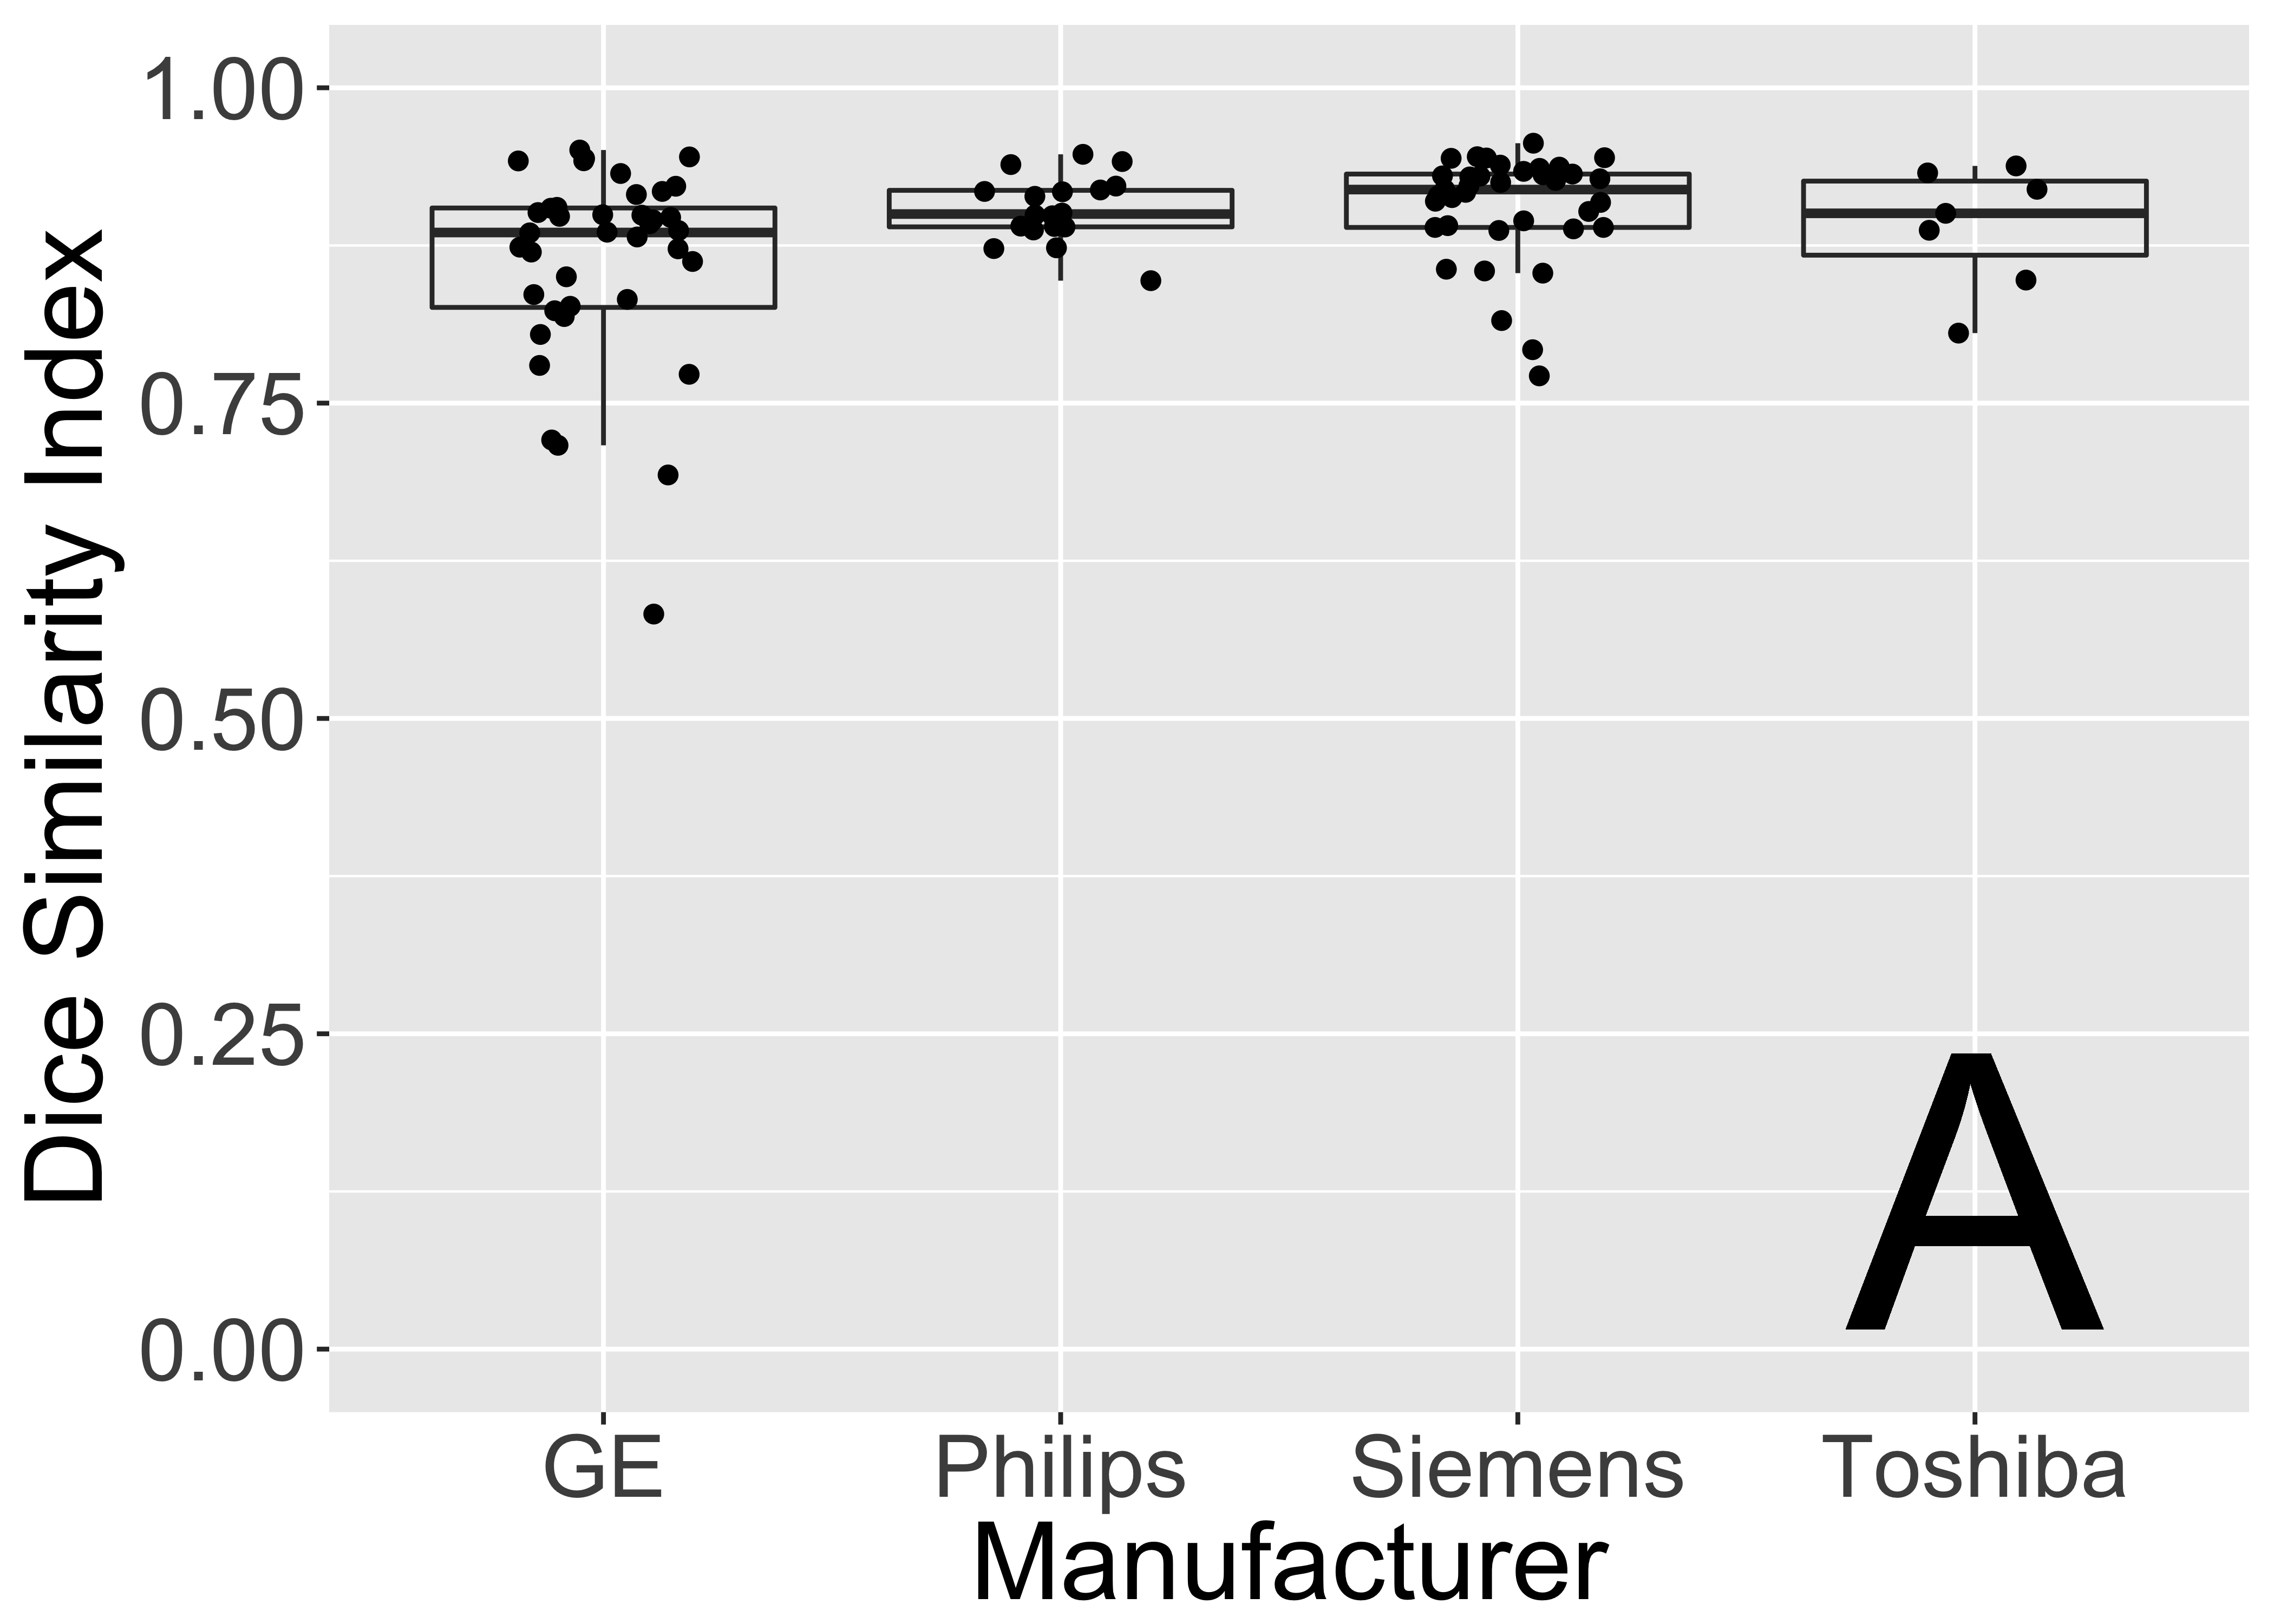
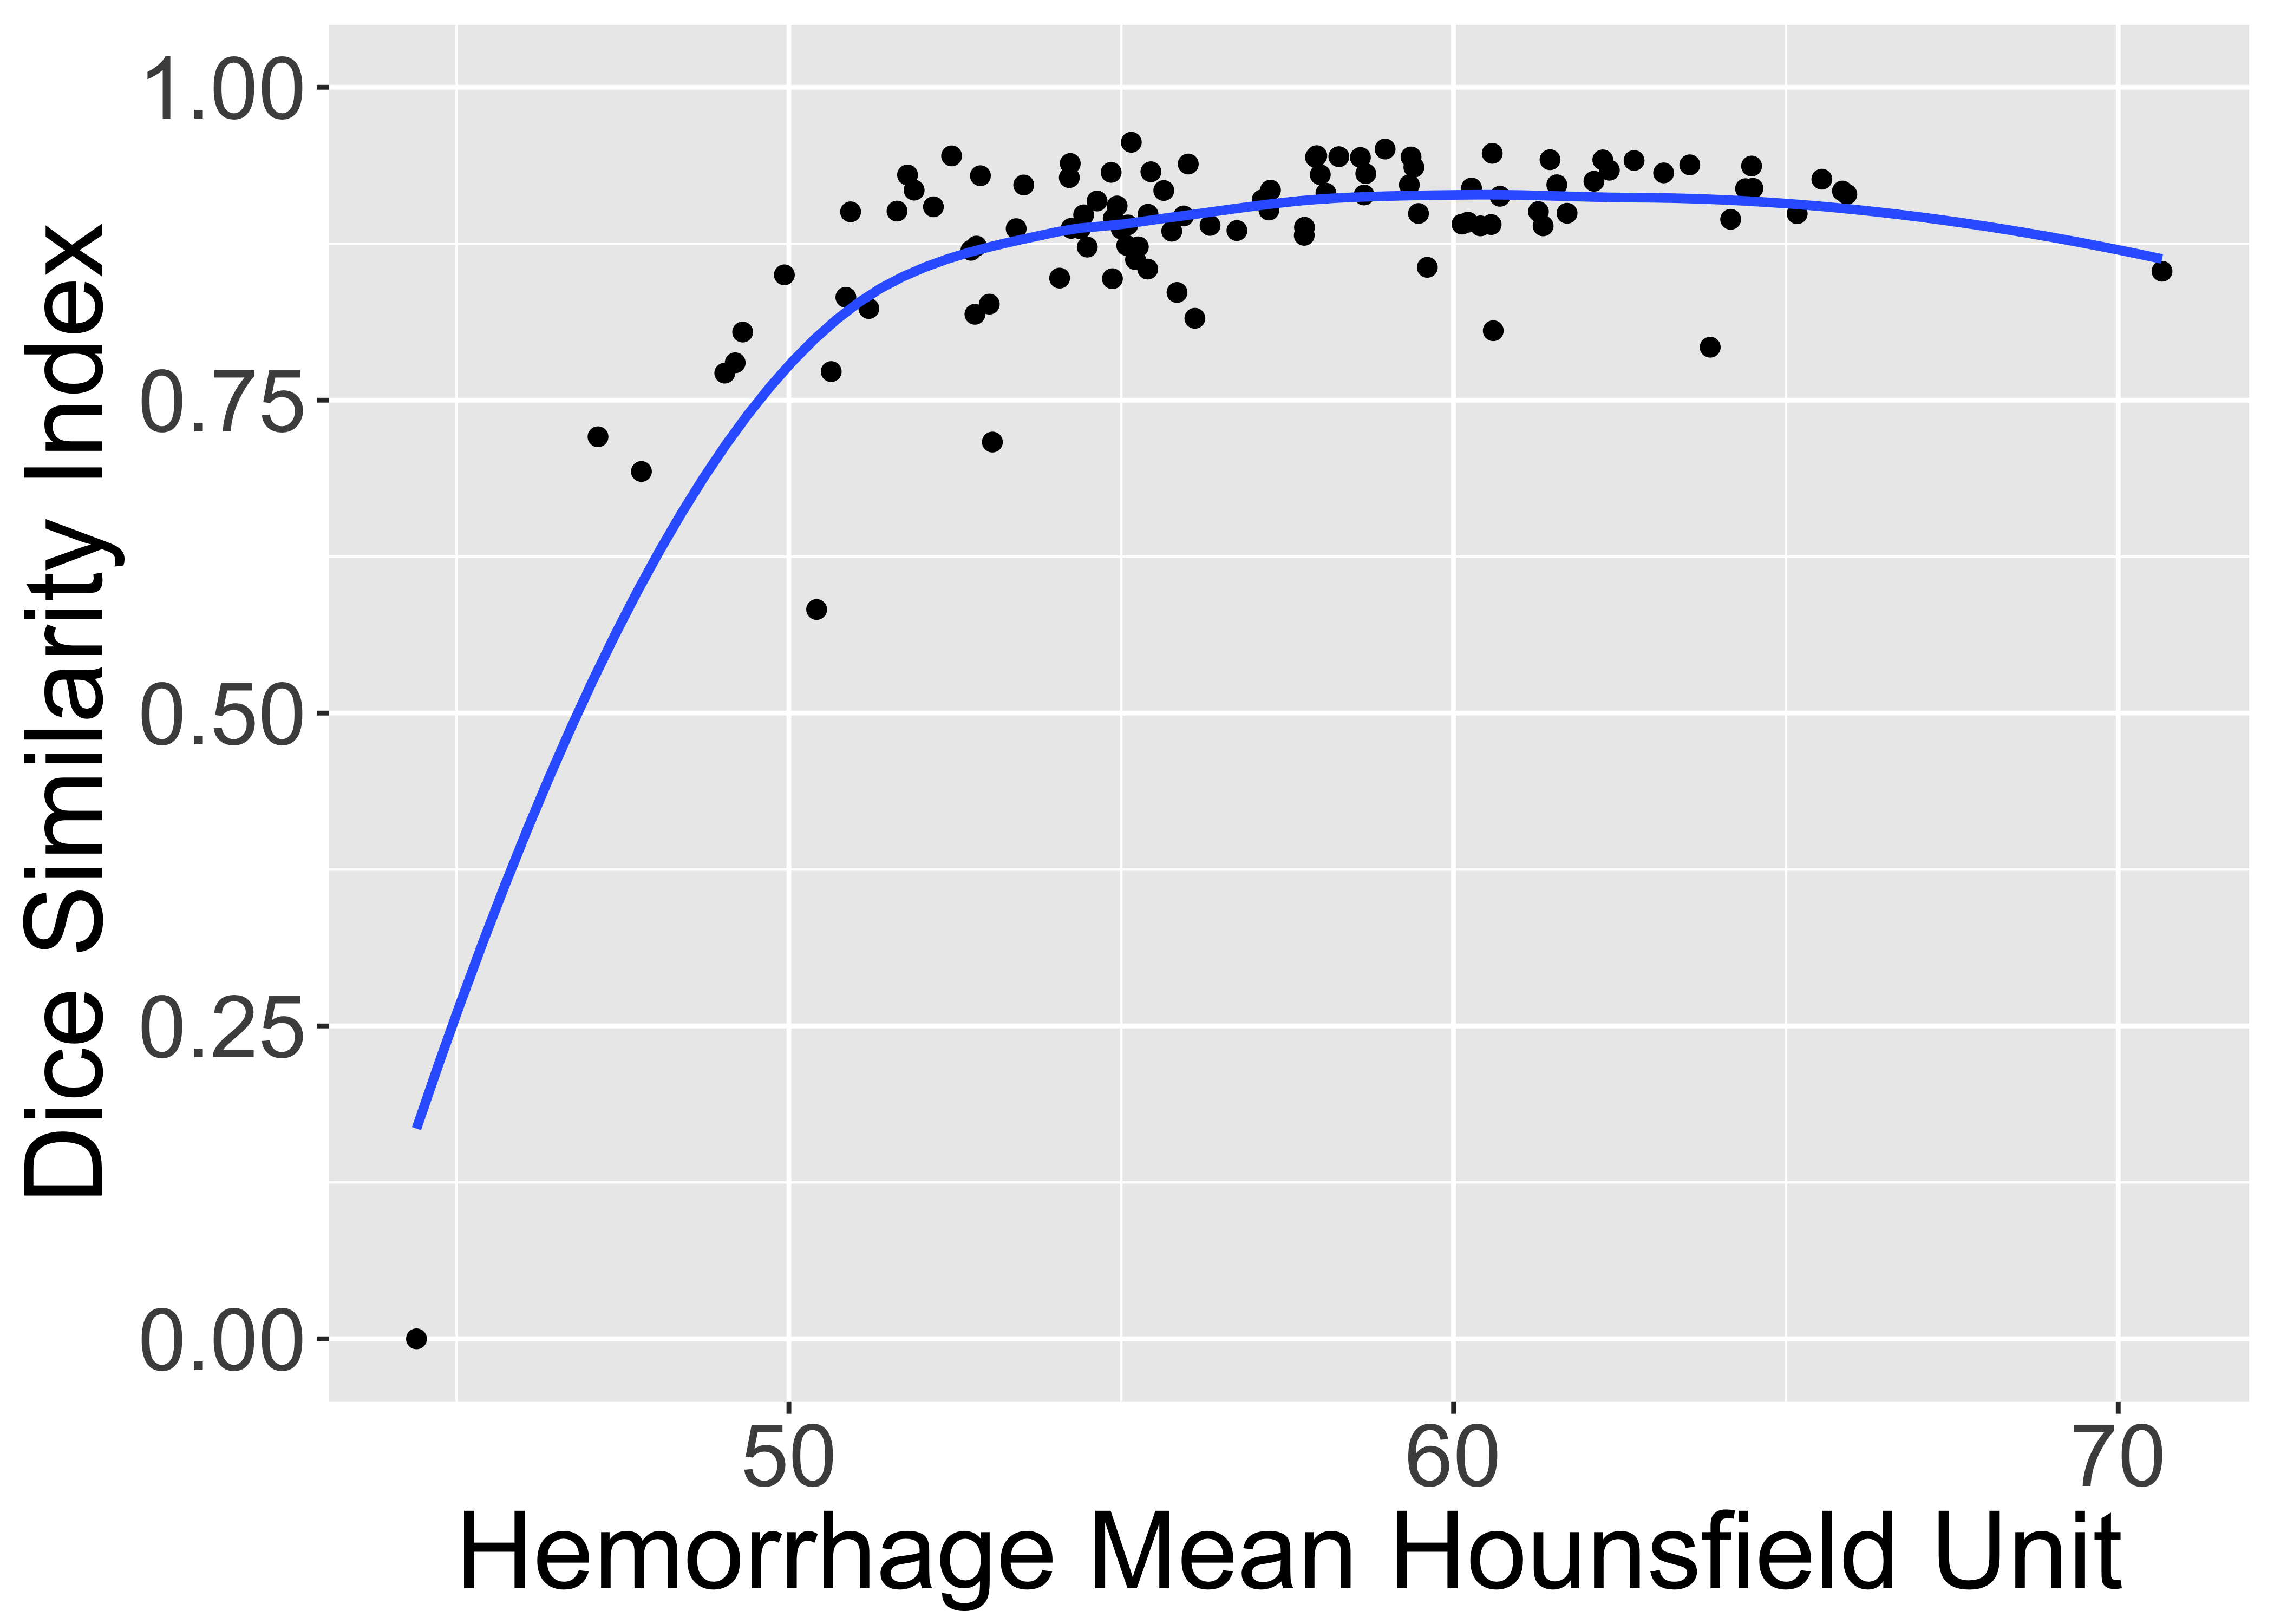
We calculate the Dice Similarity Index (DSI): \[ \definecolor{red}{RGB}{255,0,0} \definecolor{blue}{RGB}{0,0,255} \definecolor{purple}{RGB}{128,0,128} \definecolor{blac,}{RGB}{0,0,0} \frac{ \color{purple} 2 \times \# \text{TP} }{ \color{purple} 2 \times \#\text{TP} \color{black} + \color{red} \text{FN} \color{black} + \color{blue} \text{FP}} \]
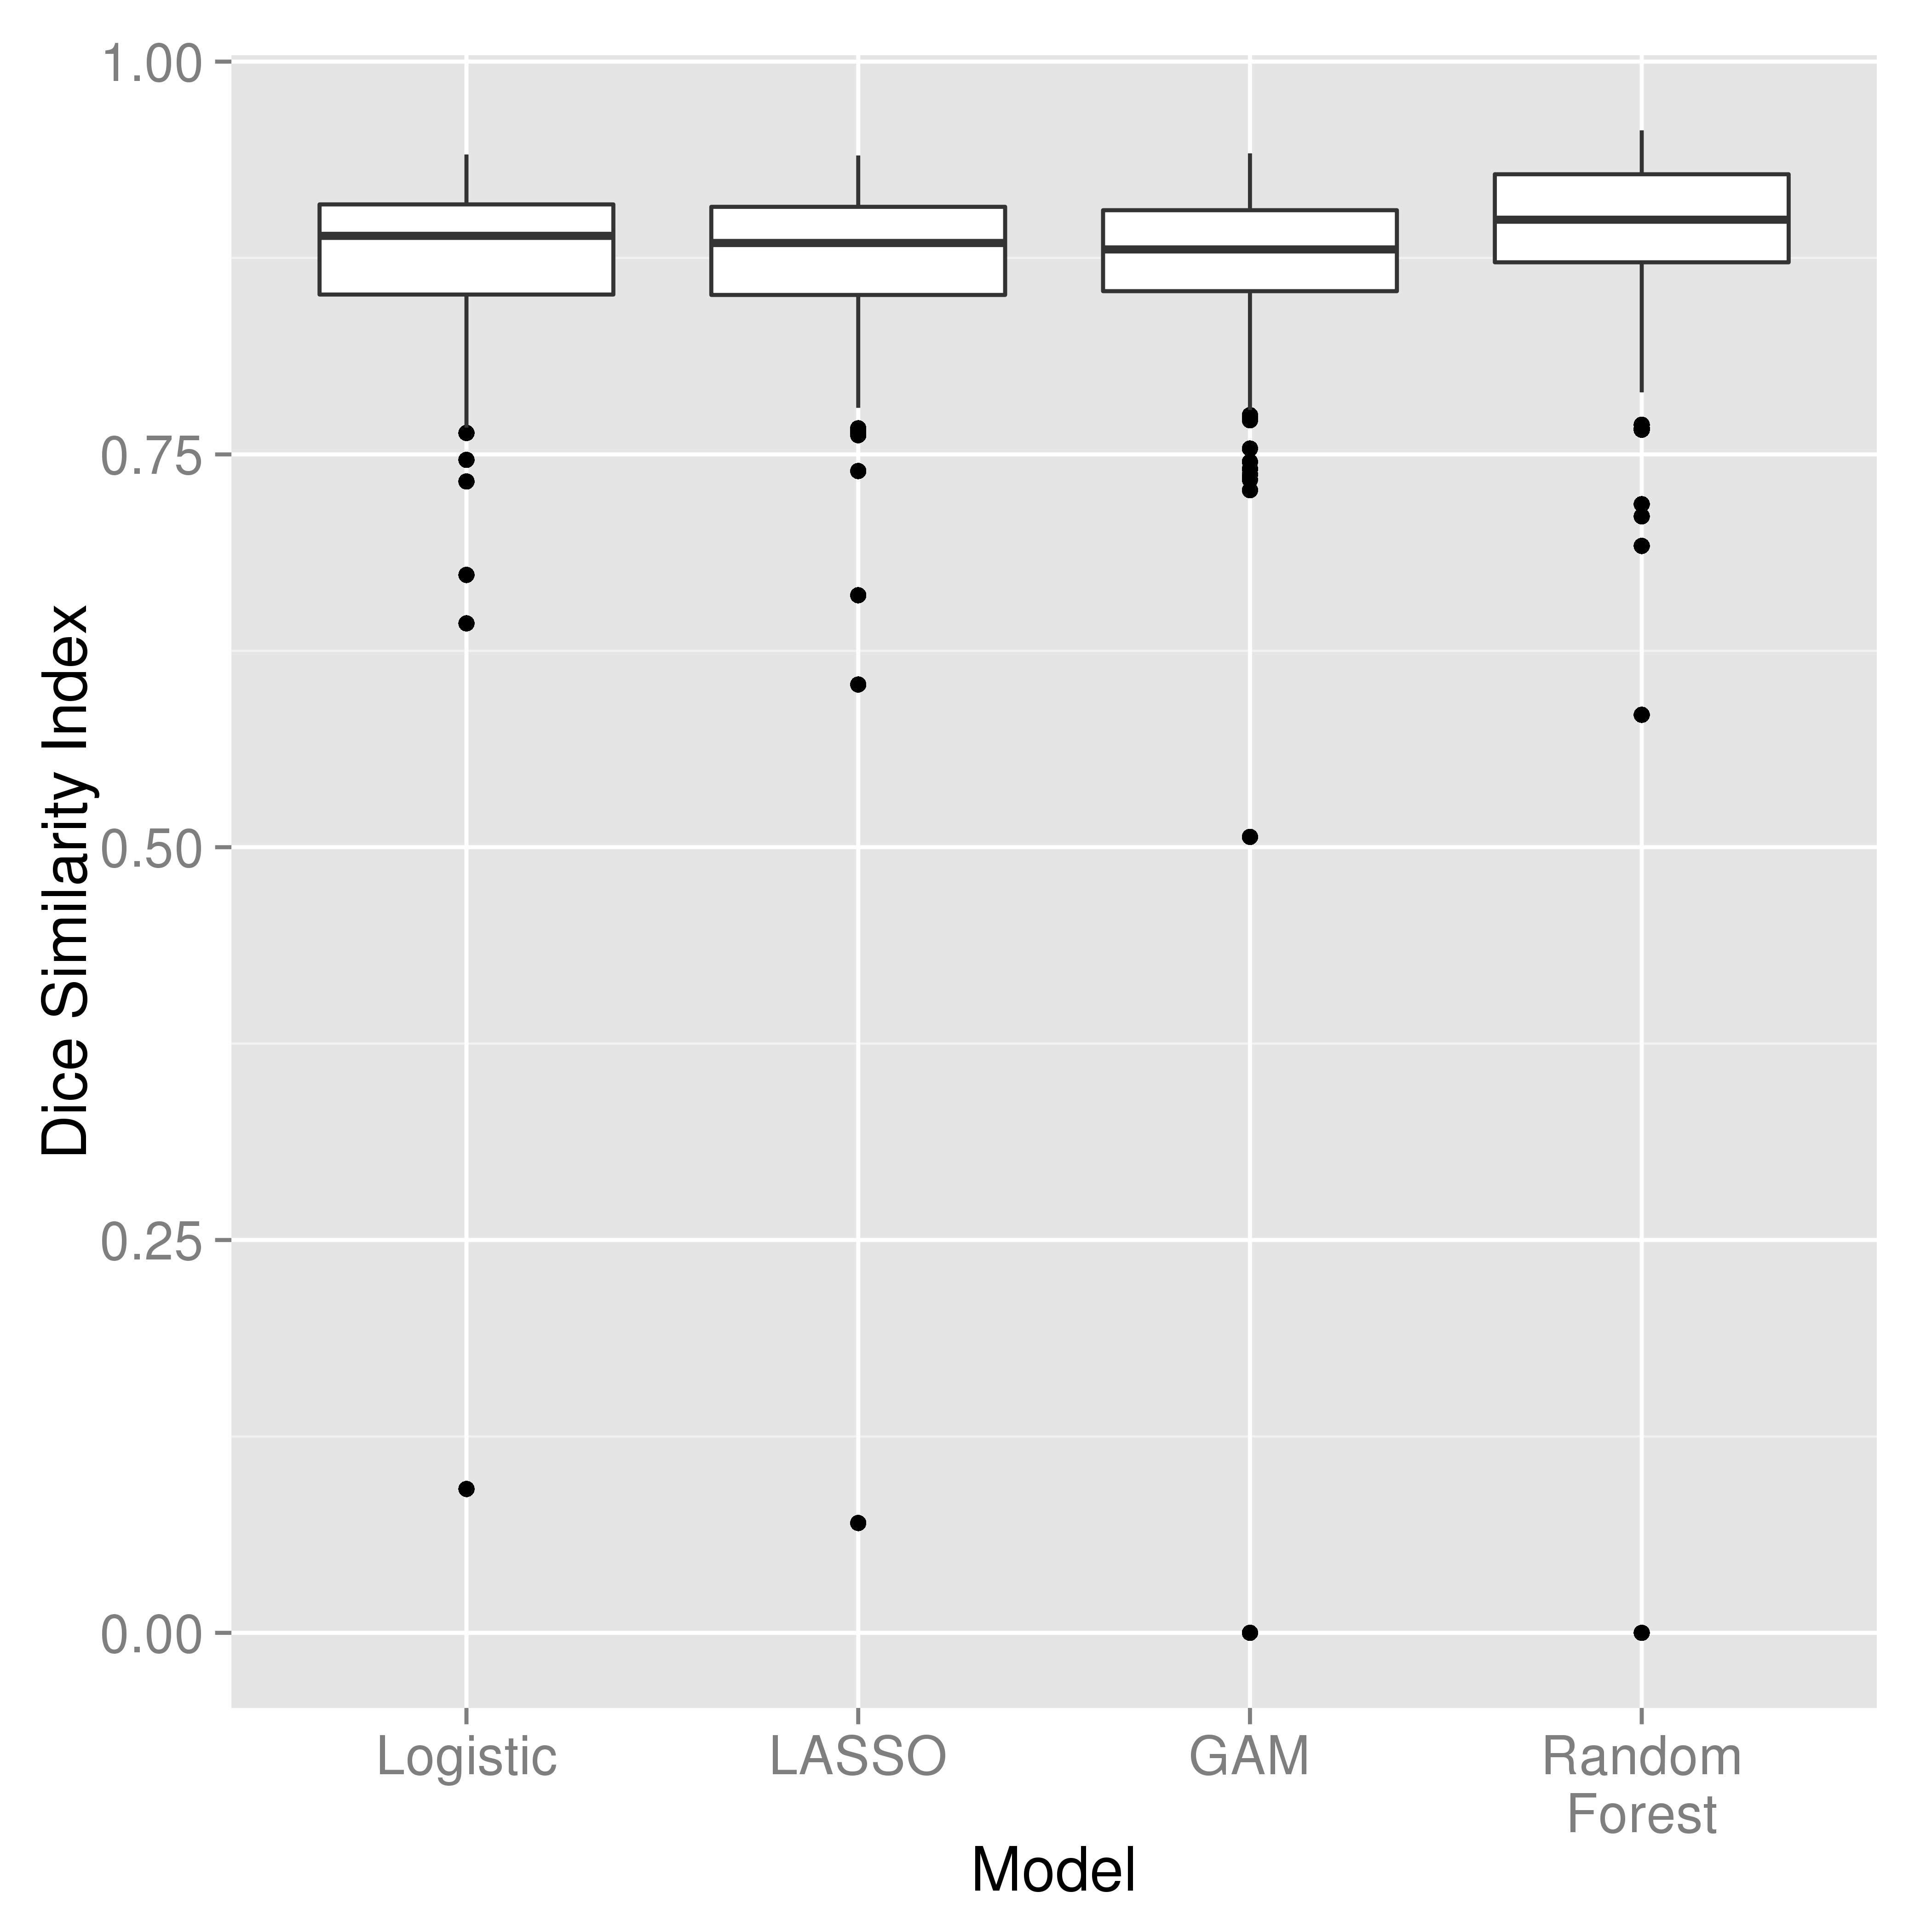
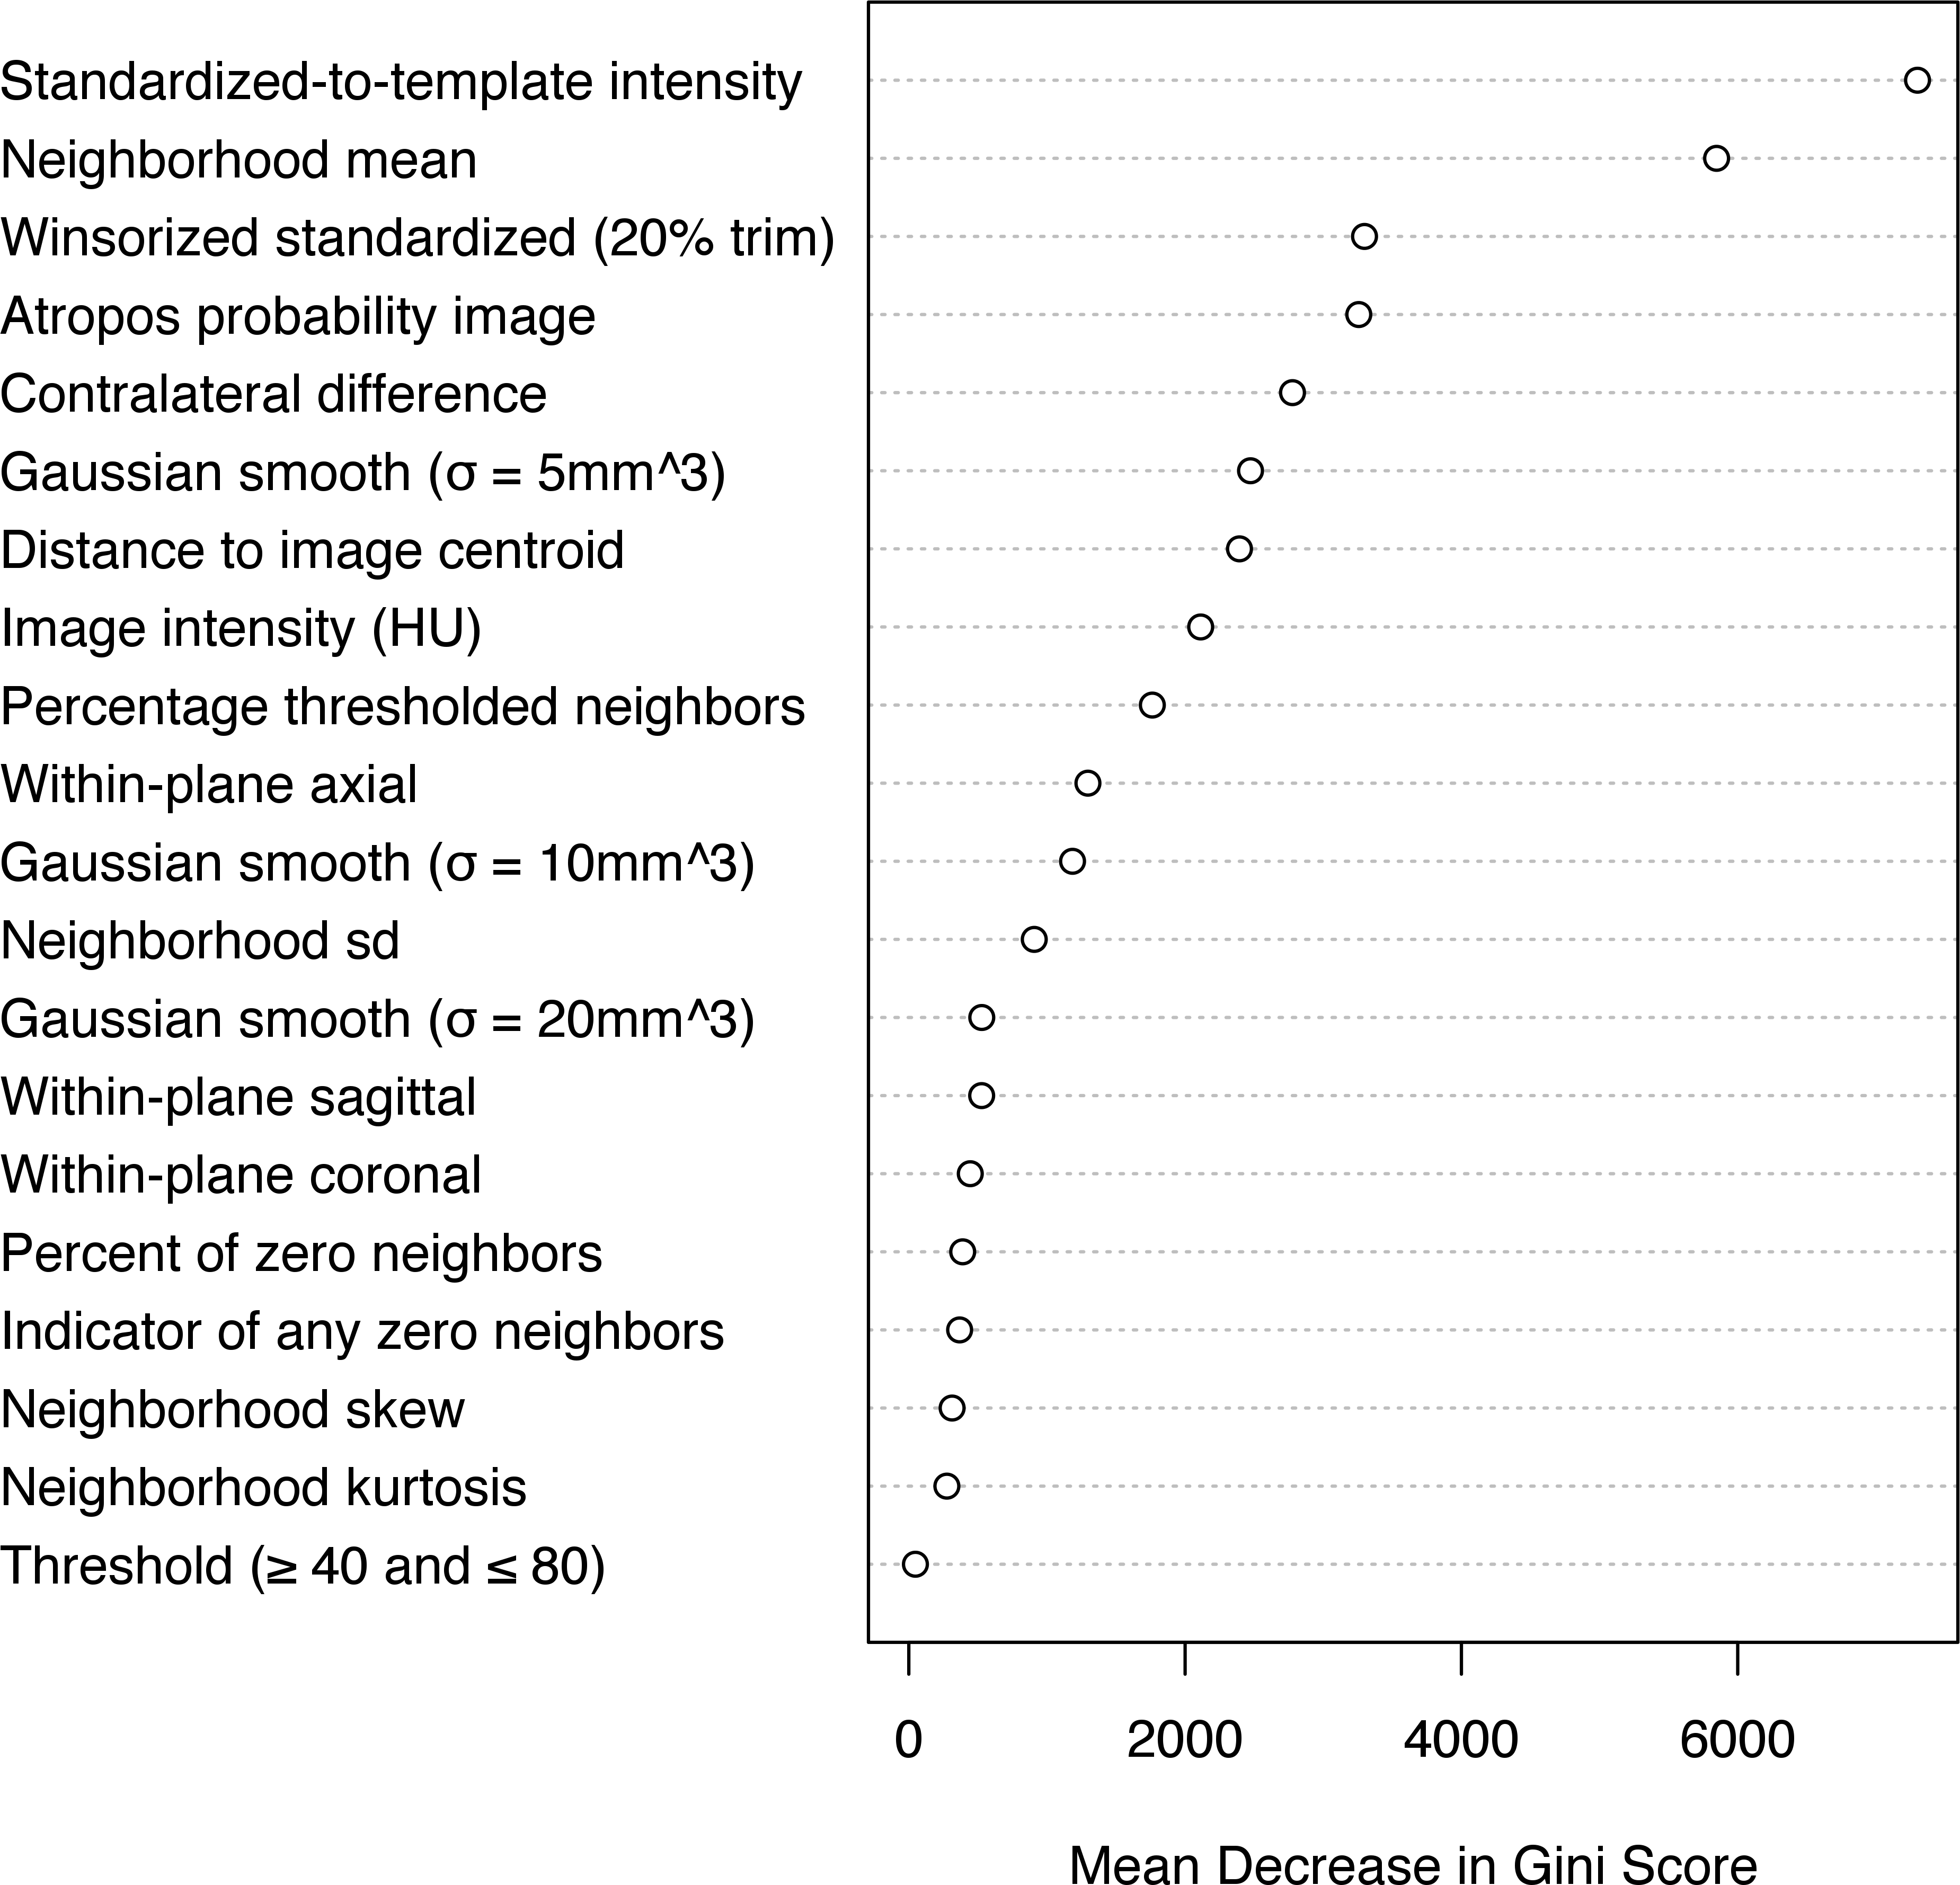
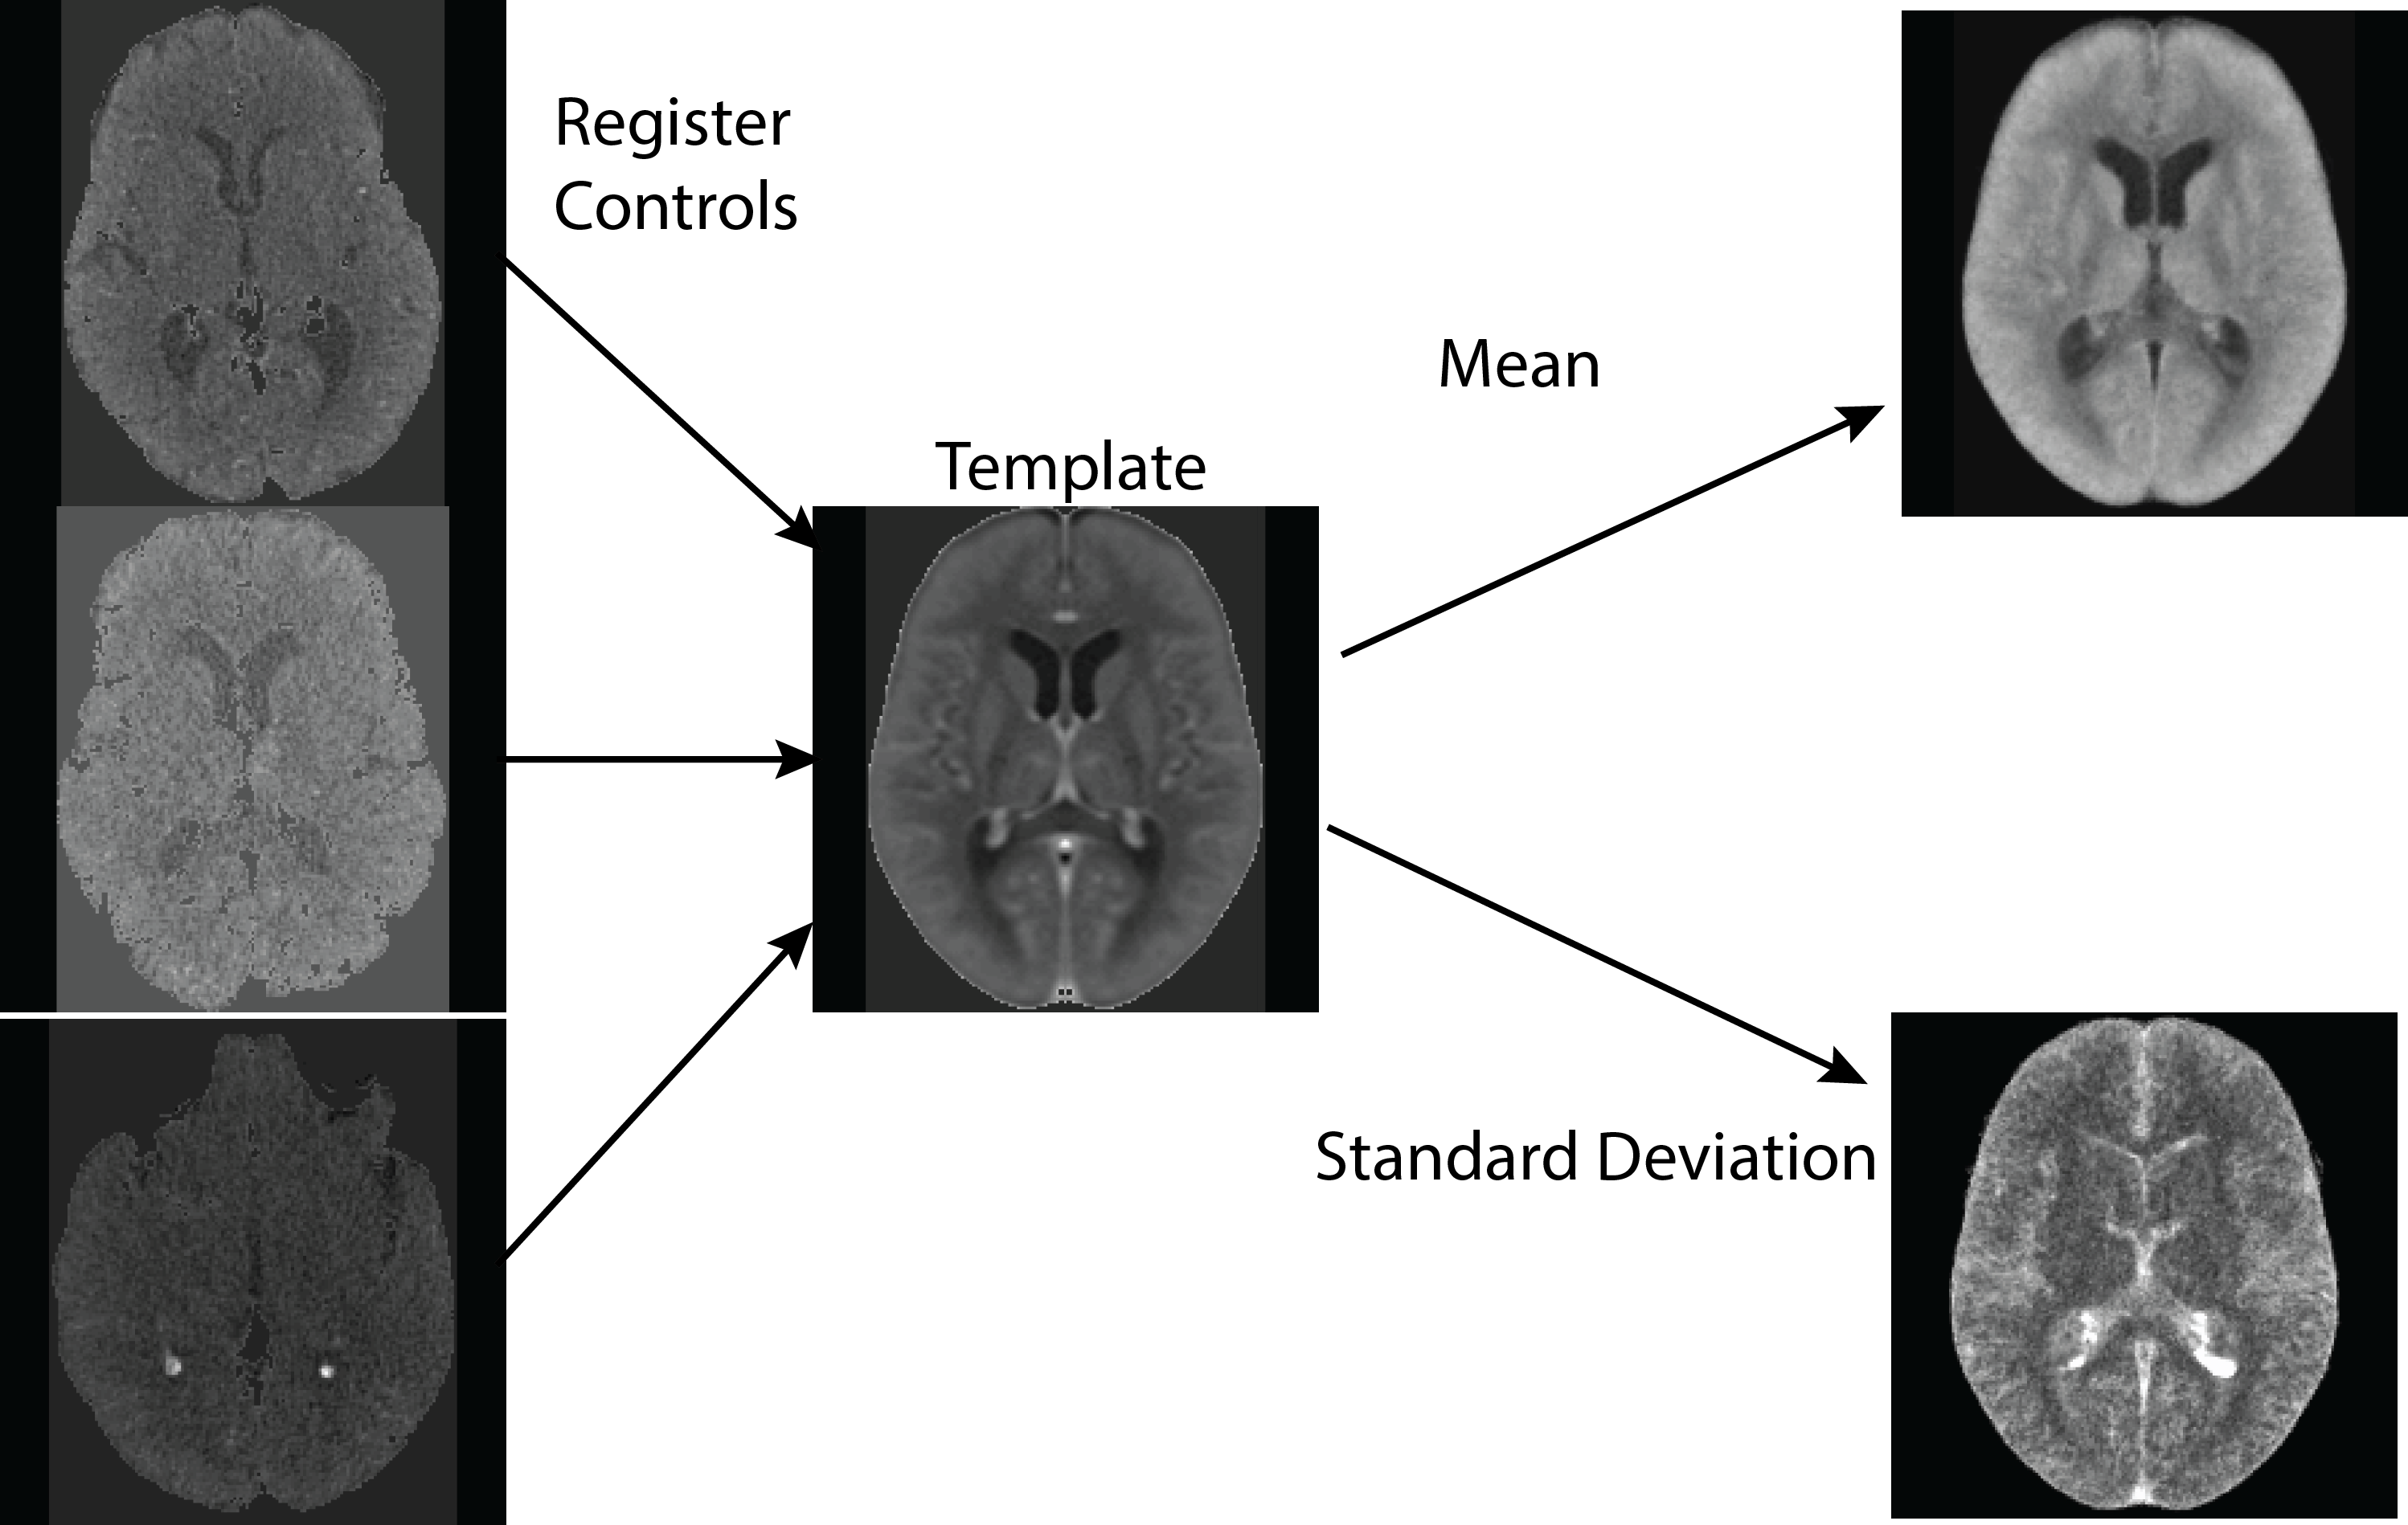
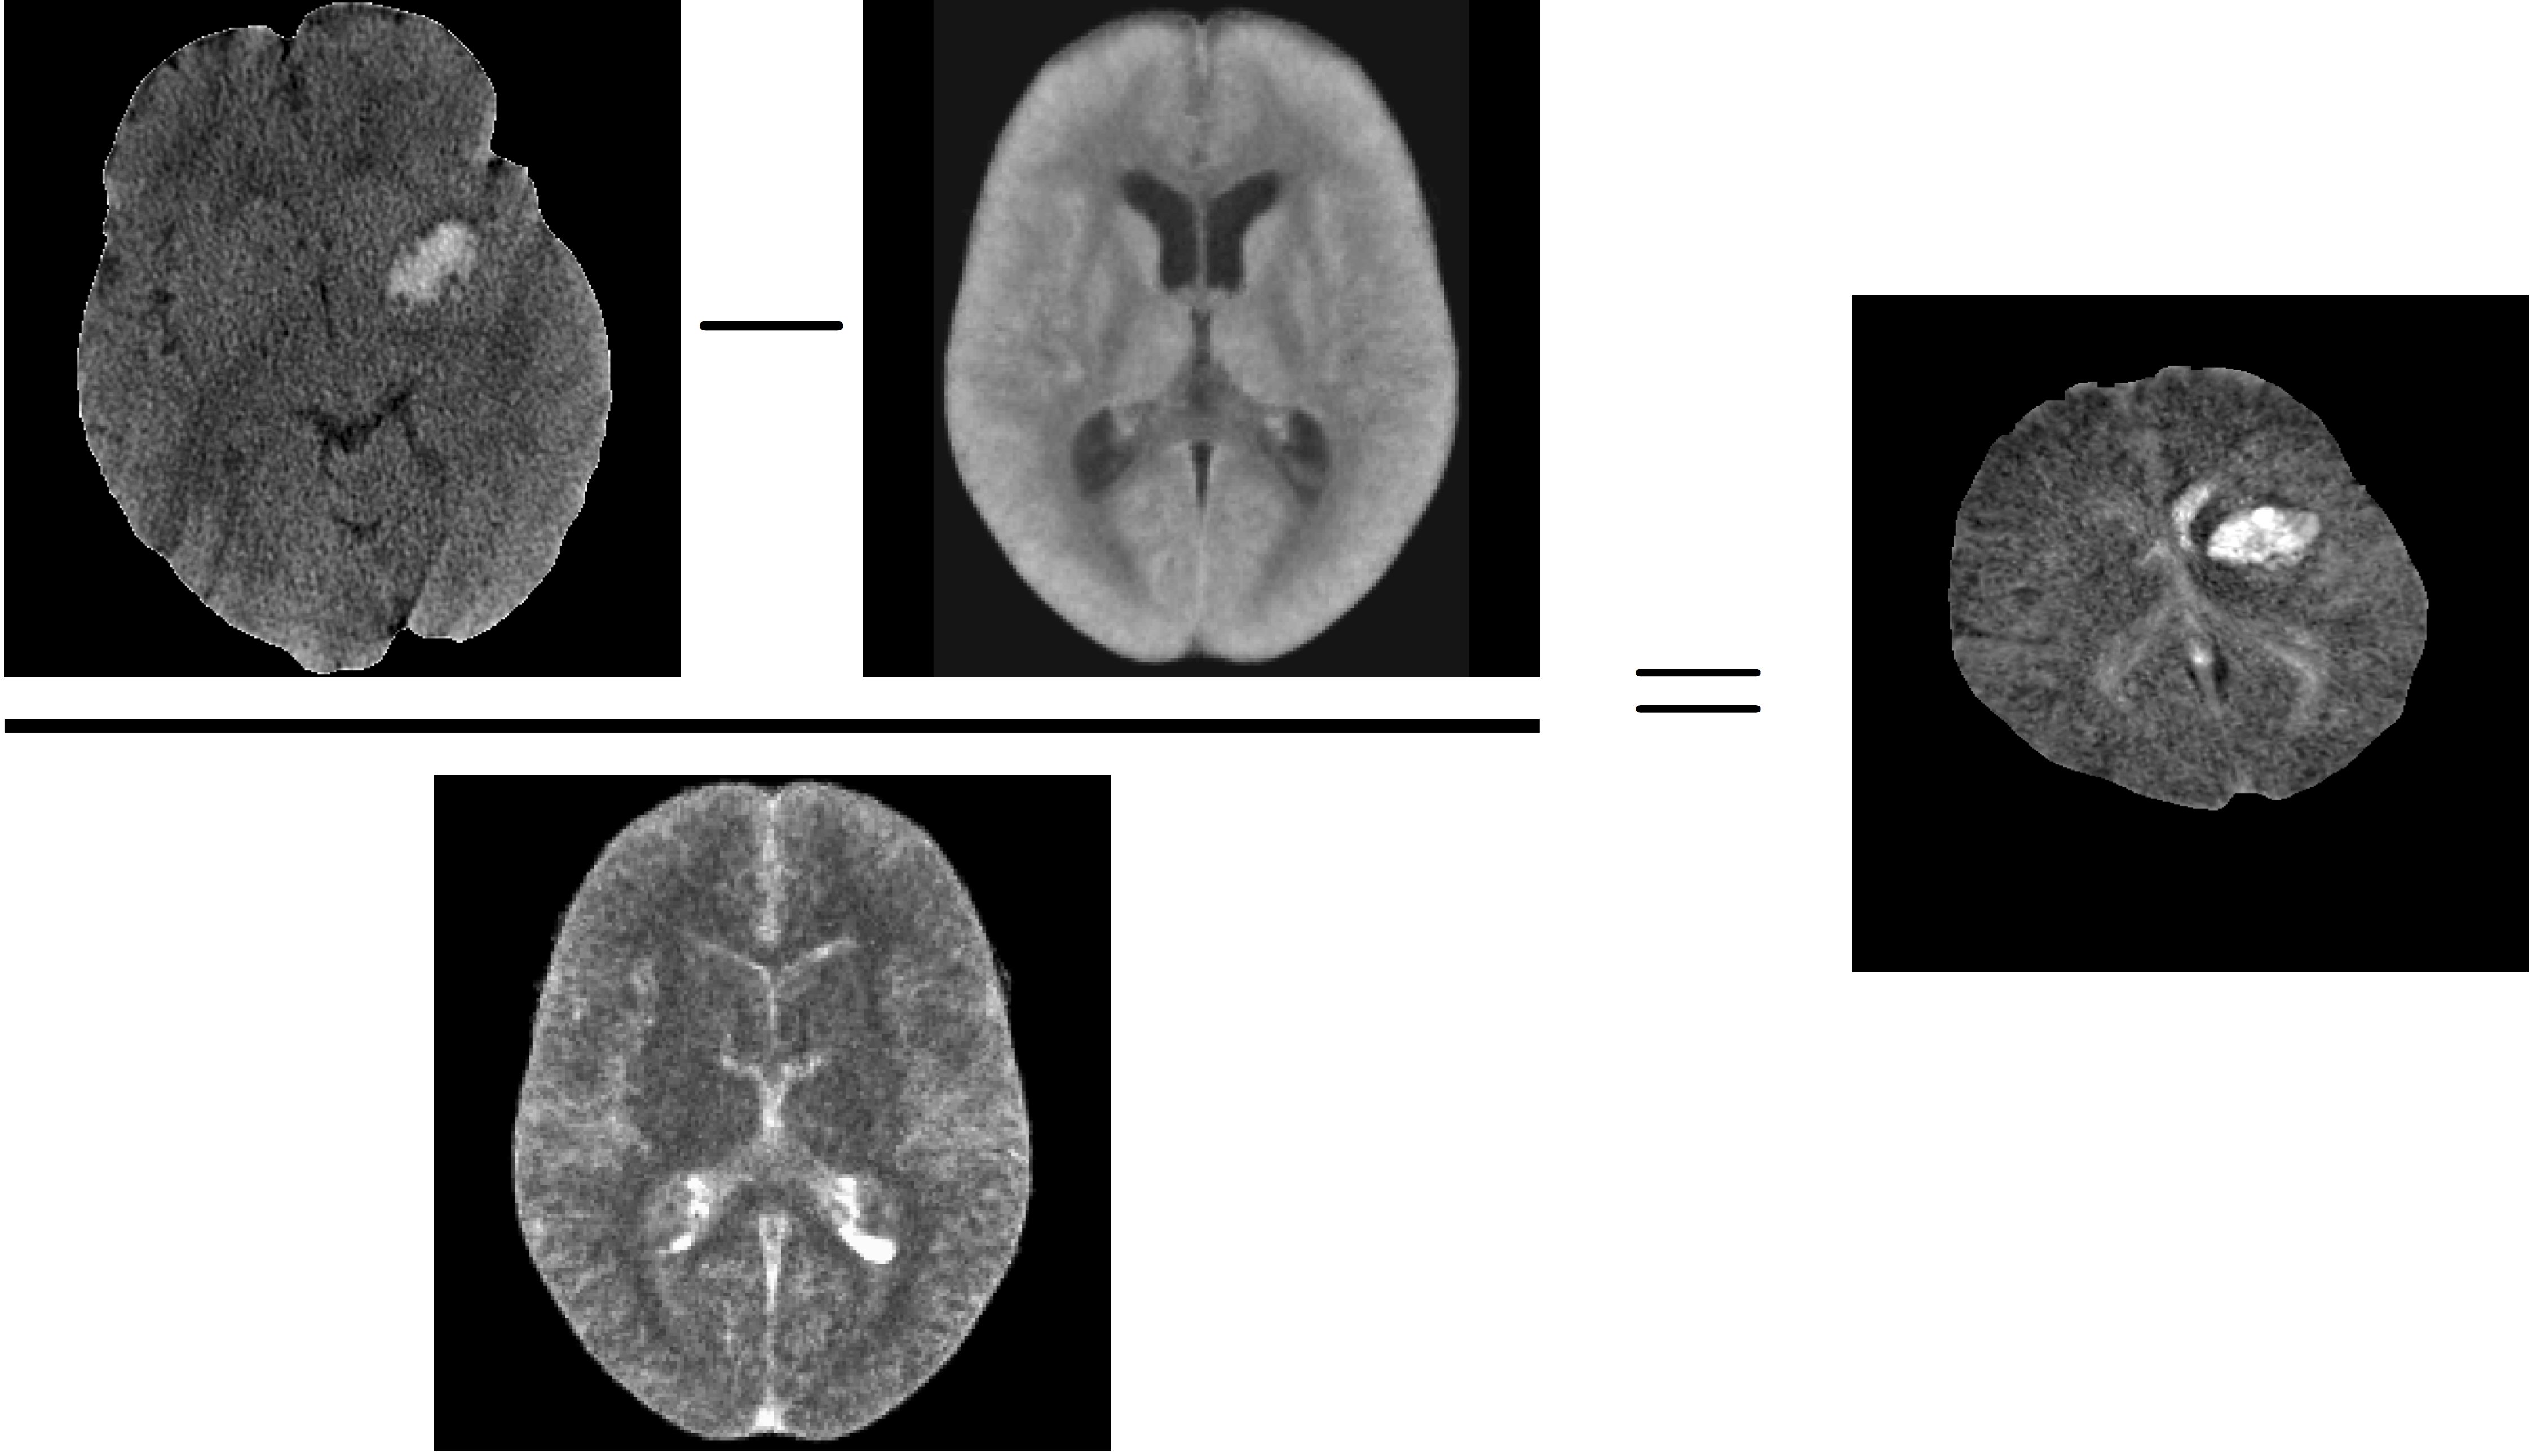
Not started yet
\(^*\) - working with Jean-Philippe Fortin on these
The knitcitations, knitr, pander, plyr, RefManageR, rmarkdown, and tableone packages were used to create this presentation in RStudio.
 setting  value
 version  R version 3.3.3 (2017-03-06)
 system   x86_64, darwin13.4.0
 ui       X11
 language (EN)
 collate  en_US.UTF-8
 tz       America/New_York
 date     2017-05-29

 package       * version    date
 backports       1.1.0      2017-05-22
 base          * 3.3.3      2017-03-07
 bibtex          0.4.0      2014-12-31
 bitops          1.0-6      2013-08-17
 class           7.3-14     2015-08-30
 colorout      * 1.1-0      2015-04-20
 datasets      * 3.3.3      2017-03-07
 devtools        1.13.1     2017-05-13
 digest          0.6.12     2017-01-27
 DT              0.2        2016-08-09
 e1071           1.6-8      2017-02-02
 evaluate        0.10       2016-10-11
 graphics      * 3.3.3      2017-03-07
 grDevices     * 3.3.3      2017-03-07
 grid            3.3.3      2017-03-07
 htmltools       0.3.6      2016-12-08
 htmlwidgets     0.8        2016-11-09
 httr            1.2.1.9000 2017-03-09
 jsonlite        1.4        2017-04-08
 knitcitations * 1.0.7.1    2016-02-01
 knitr         * 1.16       2017-05-18
 lattice         0.20-35    2017-03-25
 lubridate       1.6.0      2016-09-13
 magrittr        1.5        2014-11-22
 Matrix          1.2-10     2017-04-28
 memoise         1.1.0      2017-04-21
 methods       * 3.3.3      2017-03-07
 pander        * 0.6.0      2016-06-17
 plyr          * 1.8.4      2016-06-08
 R6              2.2.1      2017-05-10
 Rcpp            0.12.11    2017-05-22
 RCurl           1.95-4.8   2016-03-01
 RefManageR    * 0.13.1     2016-11-13
 RJSONIO         1.3-0      2014-07-28
 rmarkdown       1.5        2017-04-26
 rprojroot       1.2        2017-01-16
 splines         3.3.3      2017-03-07
 stats         * 3.3.3      2017-03-07
 stringi         1.1.5      2017-04-07
 stringr         1.2.0      2017-02-18
 survey          3.31-5     2016-12-01
 survival        2.41-3     2017-04-04
 tableone      * 0.7.3      2015-11-11
 tools           3.3.3      2017-03-07
 utils         * 3.3.3      2017-03-07
 withr           1.0.2      2016-06-20
 XML             3.98-1.7   2017-05-03
 yaml            2.1.14     2016-11-12
 zoo             1.8-0      2017-04-12
 source
 CRAN (R 3.3.2)
 local
 CRAN (R 3.2.0)
 CRAN (R 3.2.0)
 CRAN (R 3.3.3)
 Github (jalvesaq/colorout@1539f1f)
 local
 CRAN (R 3.3.2)
 cran (@0.6.12)
 CRAN (R 3.3.0)
 CRAN (R 3.3.2)
 CRAN (R 3.3.0)
 local
 local
 local
 Github (rstudio/htmltools@4fbf990)
 CRAN (R 3.3.2)
 Github (gaborcsardi/httr@30001d4)
 CRAN (R 3.3.2)
 Github (cboettig/knitcitations@afffa3e)
 CRAN (R 3.3.2)
 CRAN (R 3.3.2)
 CRAN (R 3.3.0)
 CRAN (R 3.2.0)
 CRAN (R 3.3.2)
 cran (@1.1.0)
 local
 Github (Rapporter/pander@48fa9ed)
 CRAN (R 3.3.0)
 CRAN (R 3.3.2)
 cran (@0.12.11)
 CRAN (R 3.2.4)
 CRAN (R 3.3.2)
 CRAN (R 3.2.0)
 CRAN (R 3.3.2)
 cran (@1.2)
 local
 local
 cran (@1.1.5)
 cran (@1.2.0)
 CRAN (R 3.3.2)
 CRAN (R 3.3.2)
 CRAN (R 3.2.2)
 local
 local
 CRAN (R 3.3.0)
 CRAN (R 3.3.2)
 CRAN (R 3.3.2)
 CRAN (R 3.3.2)
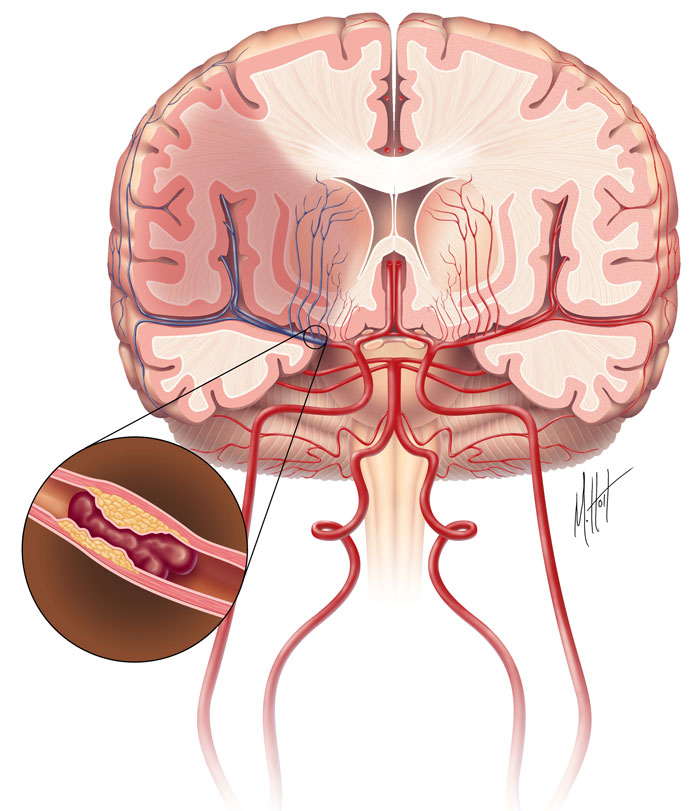
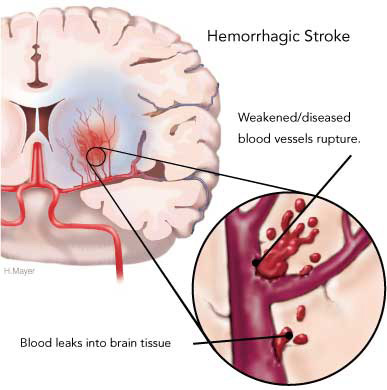
Image from http://www.strokecenter.org/patients/about-stroke/ischemic-stroke/
R Data packages for testing
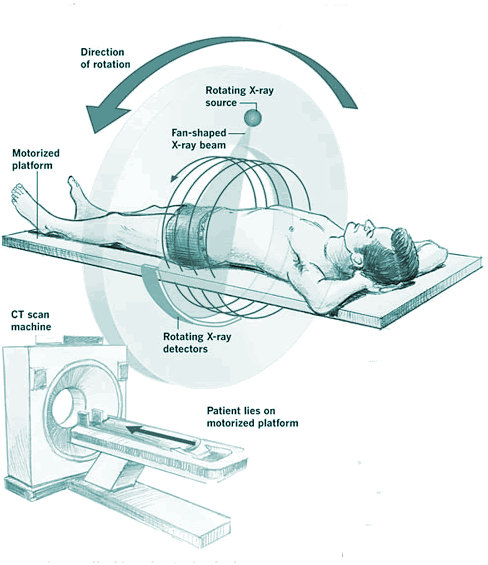
Image from http://www.strokecenter.org/patients/about-stroke/ischemic-stroke/