```{r, echo = FALSE}
library(methods)
library(knitr)
opts_chunk$set(comment = "")
```
## About Us
**John Muschelli**
Assistant Scientist, Department of Biostatistics
PhD in Biostatistics
- worked on fMRI, sMRI, and CT for ≈ 7 years
Email: jmusche1@jhu.edu
**Kristin Linn**
Assistant Professor, Department of Biostatistics and Epidemiology Perelman School of Medicine, University of Pennsylvania
PhD in Statistics
- worked on sMRI for 3 years
Email: klinn@mail.med.upenn.edu
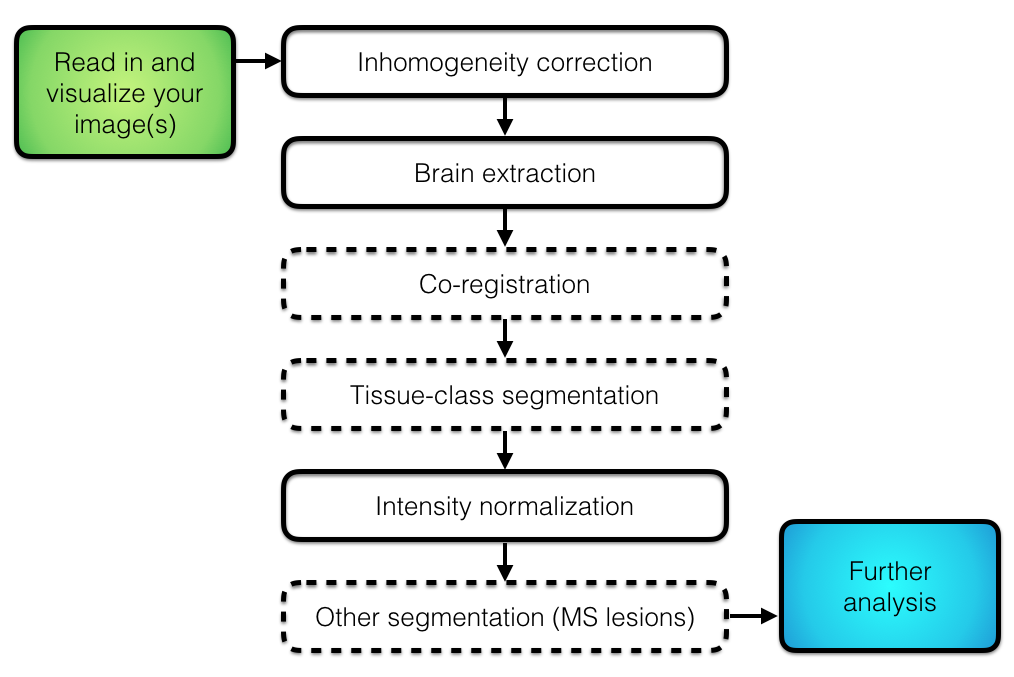
## Overall Pipeline
 ## Imaging Data Used: Multiple Sclerosis
- Multiple sclerosis (MS) is a chronic disease of the central nervous system (brain, spinal chord, optic nerves)
- MS lesions in the brain are areas of active inflammation, demylenation, or permanent tissue damage.
- lesions are primarily in the white matter
- The full data is available at https://smart-stats-tools.org.
## Imaging Data Used: Multiple Sclerosis
- MRI is well-suited for assessing lesion burden (volume and patterns) because lesions appear as hyperintensities on FLAIR and T2-w images and as hypointensities on T1-w images.
- Using 5 training and 3 test subjects data from the an open MS data set (http://lit.fe.uni-lj.si/tools.php?lang=eng) [@lesjak2017novel]
```{r readin, echo = FALSE, message=FALSE}
library(ms.lesion)
library(neurobase)
files = get_image_filenames_list_by_subject(type = "coregistered")
files = files$training02
img_fnames = files[c("T1", "T2", "FLAIR")]
mask_fname = files["mask"]
brain_mask = readnii(files["Brain_Mask"])
imgs = check_nifti(img_fnames)
mask = readnii(mask_fname)
zimgs = lapply(imgs, zscore_img, mask = brain_mask)
inds = getEmptyImageDimensions(brain_mask)
zimgs = lapply(zimgs, applyEmptyImageDimensions, inds = inds)
mask = applyEmptyImageDimensions(mask, inds = inds)
zimgs = c(zimgs, Lesion_Mask = list(mask * 10))
xyz = xyz(mask)
multi_overlay(zimgs, z = xyz[3], text = names(zimgs),
text.x = 0.5, text.y = 2.25, text.cex = 2)
```
## Formats of Images
There are multiple imaging formats. We will use NIfTI:
* Neuroimaging Informatics Technology Initiative (https://nifti.nimh.nih.gov/nifti-1)
- essentially a header and data (binary format)
- will have extension .nii (uncompressed) or .nii.gz (compressed)
- we will use 3-D images (4-D and 5-D are possible)
* ANALYZE 7.5 was a precursor to NIfTI
- had a `hdr` file (header) and `img` file (data)
## Course Website/Materials
The Course overview is located at (with slides):
http://johnmuschelli.com/ISBI_2017.html
All materials for this course (including source for the slides) is located at:
https://github.com/muschellij2/imaging_in_r
**RStudio Server**
For this course, we will use an RStudio Server because installing all the packages can be a lengthy process. Mostly all the code we show requires a Linux/Mac OSX platform for FSL and other systems:
http://johnmuschelli.com/rstudio_server.html
**Virtual Machine**
If you want to run things locally, we have a Virtual Machine you can download and install: https://neuroconductor.org/neuroc-vm
# Introduction to R
## What is R?
- R is a language and environment for statistical computing and graphics
- R was implemented over the S language, which was developed by Bell laboratories
- R is both open source and open development
(source: http://www.r-project.org/)
## Why R?
* Powerful and flexible
* Free (open source)
* Extensive add-on software (packages)
* Designed for statistical computing
* High level language
**Why not R?**
* Fairly steep learning curve
* Little centralized support, relies on online community and package developers
* Slower, and more memory intensive, than the more traditional programming languages (C, Java, Perl, Python)
## What comes with R
* R revolves around functions
* Commands that take input, performs computations, and returns results
* When you download R, it has a "base" set of functions/packages (**base R**)
* Functions are enclosed in packages
- A package is collection of functions, documentation, data, and tutorials (called vignettes).
* Written by R users/developers (like us) - **some are bad**
- You install a package using the `install.packages` command/function:
```r
install.packages("oro.nifti")
```
`install.packages` is a function, `"oro.nifti"` is a character string.
## Neuroconductor
* Most packages are in a repository [Comprehensive R Archive Network (CRAN)](https://cran.r-project.org/)
* Neuroconductor (https://neuroconductor.org/) has packages related to medical imaging
```r
source("https://neuroconductor.org/neurocLite.R")
neuro_install("oro.nifti")
```
## Loading Packages
When you install a package, it's downloaded to the hard disk. That *doesn't* mean that you can use the functions from that package just yet.
- You "load"/import a package into memory using the `library` command
For example, to load the `oro.nifti` package:
```r
library(oro.nifti)
```
Now, functions from the `oro.nifti` package can be used.
## RStudio (the software)
RStudio is an Integrated Development Environment (IDE) for R (made by RStudio the company)
* It helps the user effectively and more easily use R.
* Syntax highlighting, code completion, and smart indentation
* Easily manage multiple working directories and projects
* Is NOT dropdown statistical tools (such as Stata)
* See [Rcmdr](https://cran.r-project.org/web/packages/Rcmdr/index.html) or [Radiant](http://vnijs.github.io/radiant/)
# R essentially is a command line with a set of functions loaded
## RStudio/R Console
* Where code is executed (where things happen)
* You can type here for things interactively
* Code is **not saved** on your disk
* Can act as a calculator
* Creating variables/objects
* Applying functions
## RStudio/R Console
## Imaging Data Used: Multiple Sclerosis
- Multiple sclerosis (MS) is a chronic disease of the central nervous system (brain, spinal chord, optic nerves)
- MS lesions in the brain are areas of active inflammation, demylenation, or permanent tissue damage.
- lesions are primarily in the white matter
- The full data is available at https://smart-stats-tools.org.
## Imaging Data Used: Multiple Sclerosis
- MRI is well-suited for assessing lesion burden (volume and patterns) because lesions appear as hyperintensities on FLAIR and T2-w images and as hypointensities on T1-w images.
- Using 5 training and 3 test subjects data from the an open MS data set (http://lit.fe.uni-lj.si/tools.php?lang=eng) [@lesjak2017novel]
```{r readin, echo = FALSE, message=FALSE}
library(ms.lesion)
library(neurobase)
files = get_image_filenames_list_by_subject(type = "coregistered")
files = files$training02
img_fnames = files[c("T1", "T2", "FLAIR")]
mask_fname = files["mask"]
brain_mask = readnii(files["Brain_Mask"])
imgs = check_nifti(img_fnames)
mask = readnii(mask_fname)
zimgs = lapply(imgs, zscore_img, mask = brain_mask)
inds = getEmptyImageDimensions(brain_mask)
zimgs = lapply(zimgs, applyEmptyImageDimensions, inds = inds)
mask = applyEmptyImageDimensions(mask, inds = inds)
zimgs = c(zimgs, Lesion_Mask = list(mask * 10))
xyz = xyz(mask)
multi_overlay(zimgs, z = xyz[3], text = names(zimgs),
text.x = 0.5, text.y = 2.25, text.cex = 2)
```
## Formats of Images
There are multiple imaging formats. We will use NIfTI:
* Neuroimaging Informatics Technology Initiative (https://nifti.nimh.nih.gov/nifti-1)
- essentially a header and data (binary format)
- will have extension .nii (uncompressed) or .nii.gz (compressed)
- we will use 3-D images (4-D and 5-D are possible)
* ANALYZE 7.5 was a precursor to NIfTI
- had a `hdr` file (header) and `img` file (data)
## Course Website/Materials
The Course overview is located at (with slides):
http://johnmuschelli.com/ISBI_2017.html
All materials for this course (including source for the slides) is located at:
https://github.com/muschellij2/imaging_in_r
**RStudio Server**
For this course, we will use an RStudio Server because installing all the packages can be a lengthy process. Mostly all the code we show requires a Linux/Mac OSX platform for FSL and other systems:
http://johnmuschelli.com/rstudio_server.html
**Virtual Machine**
If you want to run things locally, we have a Virtual Machine you can download and install: https://neuroconductor.org/neuroc-vm
# Introduction to R
## What is R?
- R is a language and environment for statistical computing and graphics
- R was implemented over the S language, which was developed by Bell laboratories
- R is both open source and open development
(source: http://www.r-project.org/)
## Why R?
* Powerful and flexible
* Free (open source)
* Extensive add-on software (packages)
* Designed for statistical computing
* High level language
**Why not R?**
* Fairly steep learning curve
* Little centralized support, relies on online community and package developers
* Slower, and more memory intensive, than the more traditional programming languages (C, Java, Perl, Python)
## What comes with R
* R revolves around functions
* Commands that take input, performs computations, and returns results
* When you download R, it has a "base" set of functions/packages (**base R**)
* Functions are enclosed in packages
- A package is collection of functions, documentation, data, and tutorials (called vignettes).
* Written by R users/developers (like us) - **some are bad**
- You install a package using the `install.packages` command/function:
```r
install.packages("oro.nifti")
```
`install.packages` is a function, `"oro.nifti"` is a character string.
## Neuroconductor
* Most packages are in a repository [Comprehensive R Archive Network (CRAN)](https://cran.r-project.org/)
* Neuroconductor (https://neuroconductor.org/) has packages related to medical imaging
```r
source("https://neuroconductor.org/neurocLite.R")
neuro_install("oro.nifti")
```
## Loading Packages
When you install a package, it's downloaded to the hard disk. That *doesn't* mean that you can use the functions from that package just yet.
- You "load"/import a package into memory using the `library` command
For example, to load the `oro.nifti` package:
```r
library(oro.nifti)
```
Now, functions from the `oro.nifti` package can be used.
## RStudio (the software)
RStudio is an Integrated Development Environment (IDE) for R (made by RStudio the company)
* It helps the user effectively and more easily use R.
* Syntax highlighting, code completion, and smart indentation
* Easily manage multiple working directories and projects
* Is NOT dropdown statistical tools (such as Stata)
* See [Rcmdr](https://cran.r-project.org/web/packages/Rcmdr/index.html) or [Radiant](http://vnijs.github.io/radiant/)
# R essentially is a command line with a set of functions loaded
## RStudio/R Console
* Where code is executed (where things happen)
* You can type here for things interactively
* Code is **not saved** on your disk
* Can act as a calculator
* Creating variables/objects
* Applying functions
## RStudio/R Console 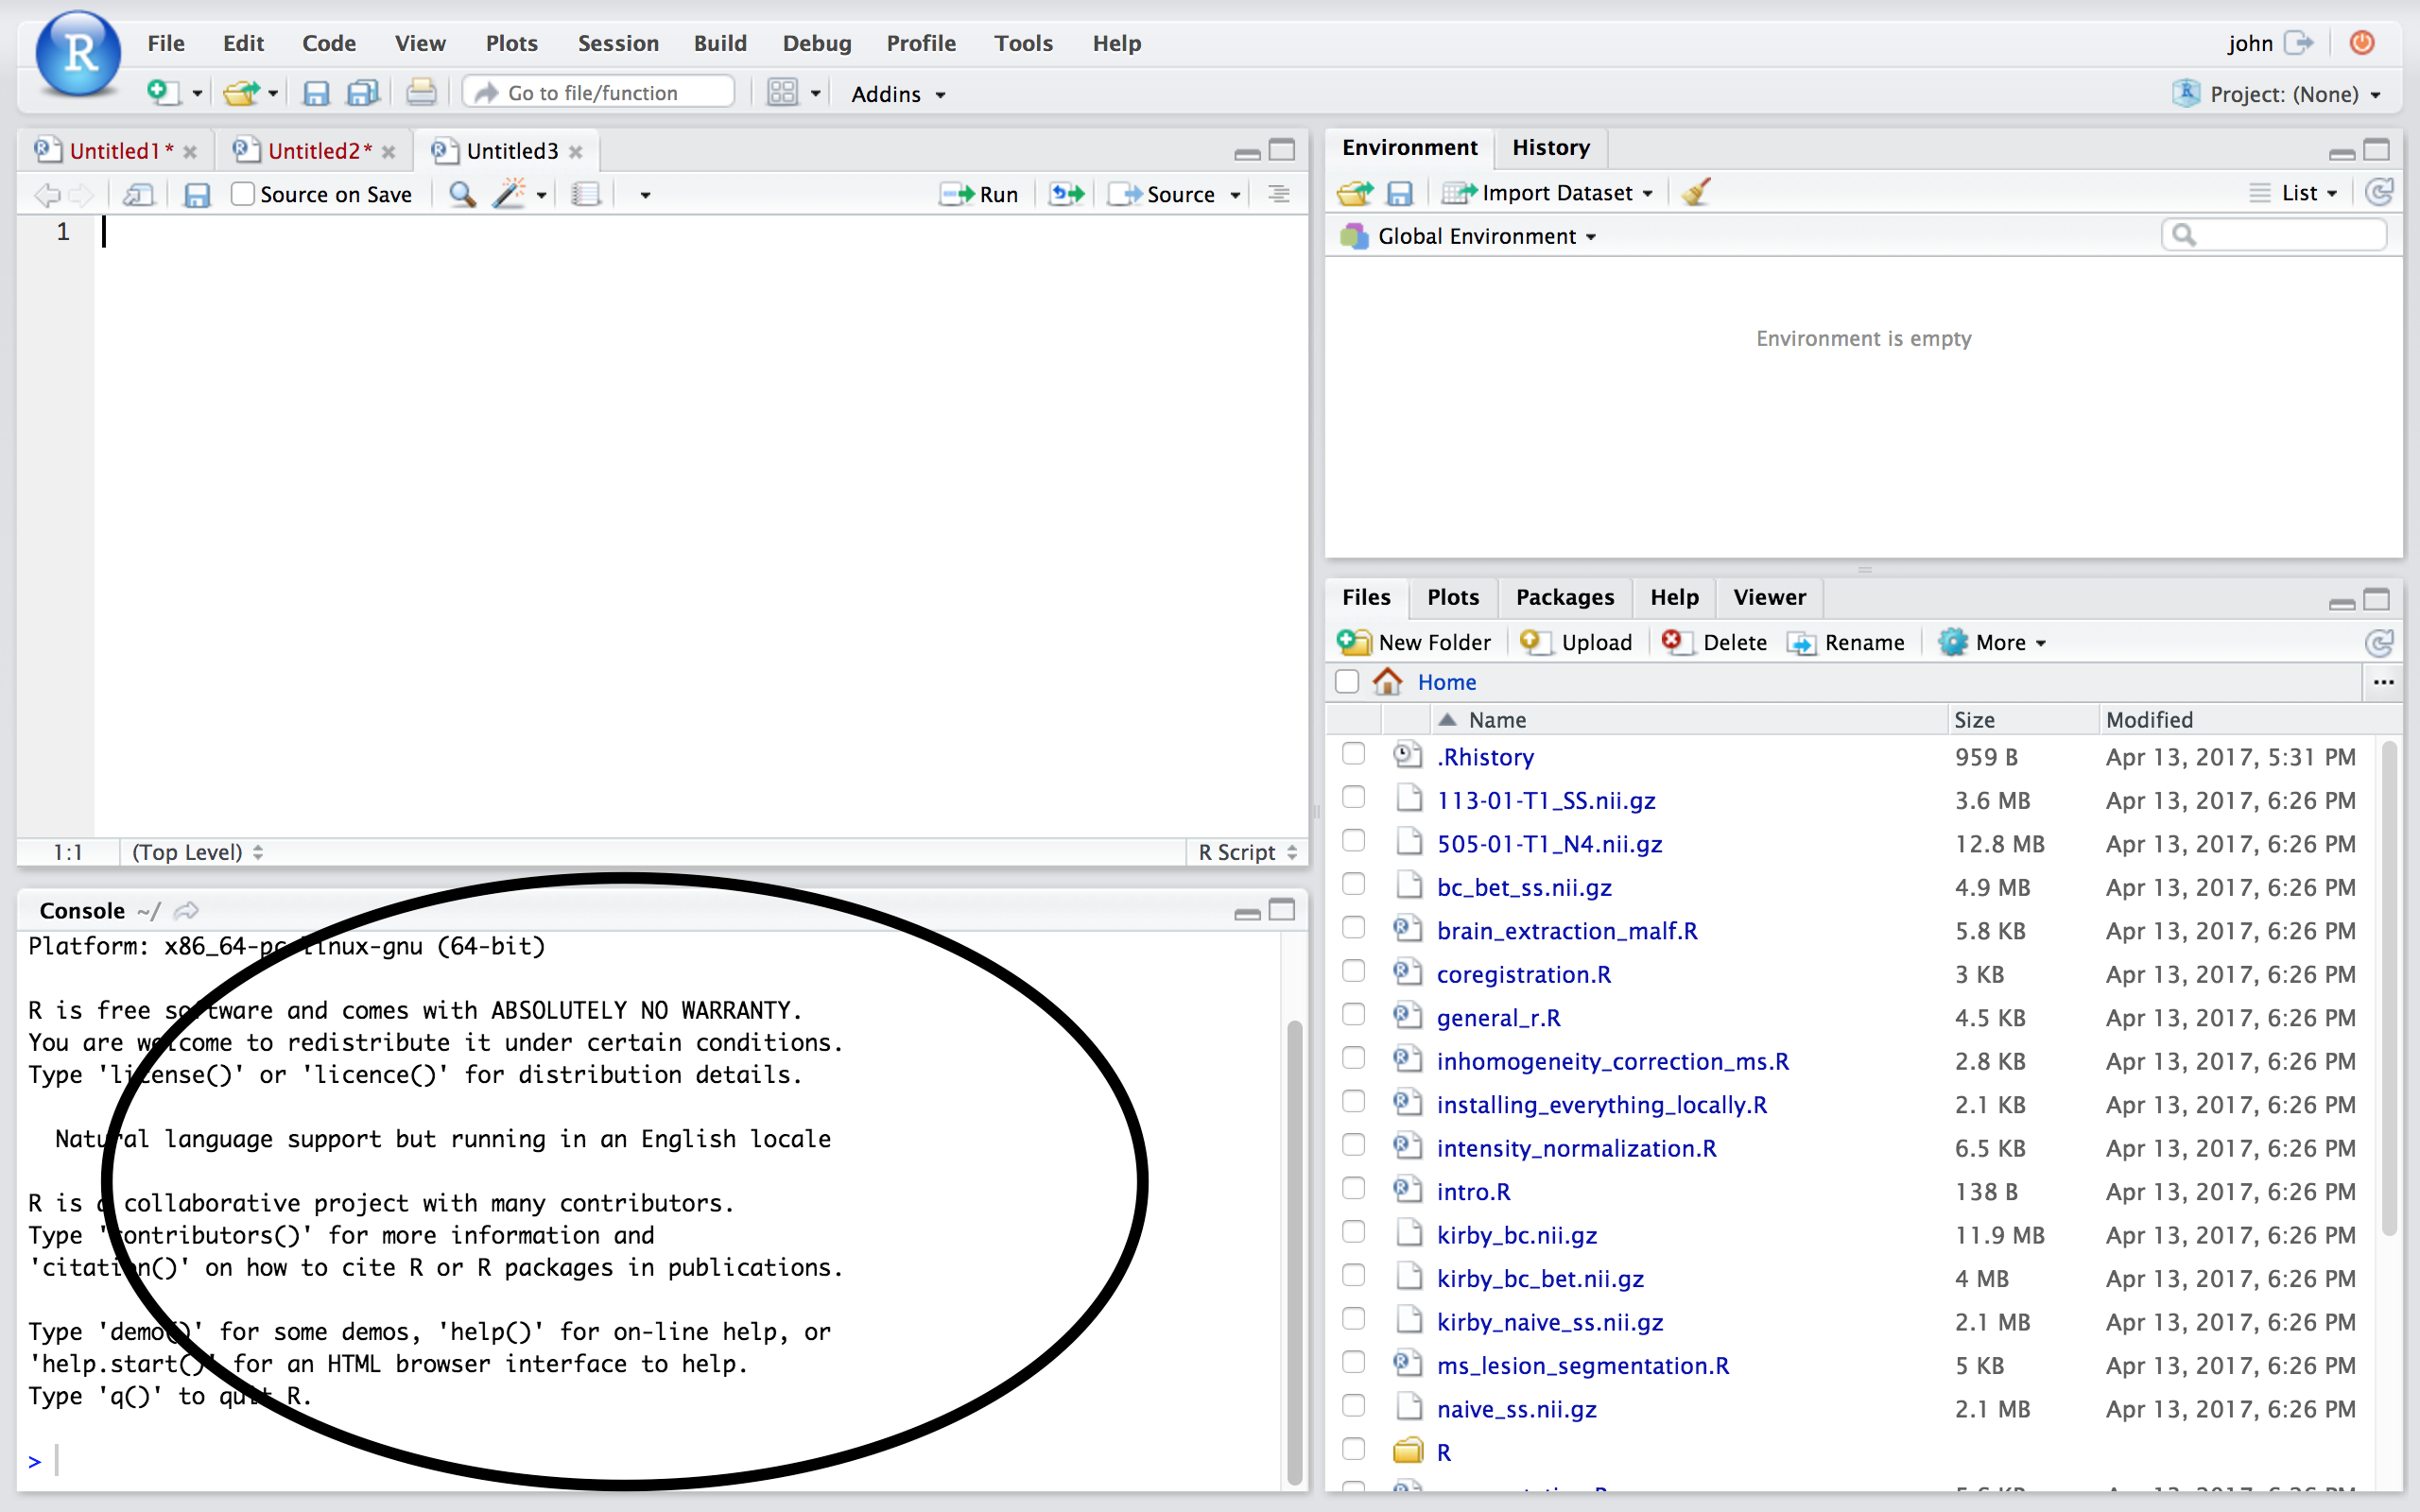 ## Source
* Where files open to
* Have R code and comments in them
* Static copy of what you did (reproducibility)
* Try things out interactively, then add to your script
* Can highlight and press (CMD+Enter (Mac) or Ctrl+Enter (Windows)) to run the code
* Code is saved to disk
## Source/Editor
## Source
* Where files open to
* Have R code and comments in them
* Static copy of what you did (reproducibility)
* Try things out interactively, then add to your script
* Can highlight and press (CMD+Enter (Mac) or Ctrl+Enter (Windows)) to run the code
* Code is saved to disk
## Source/Editor 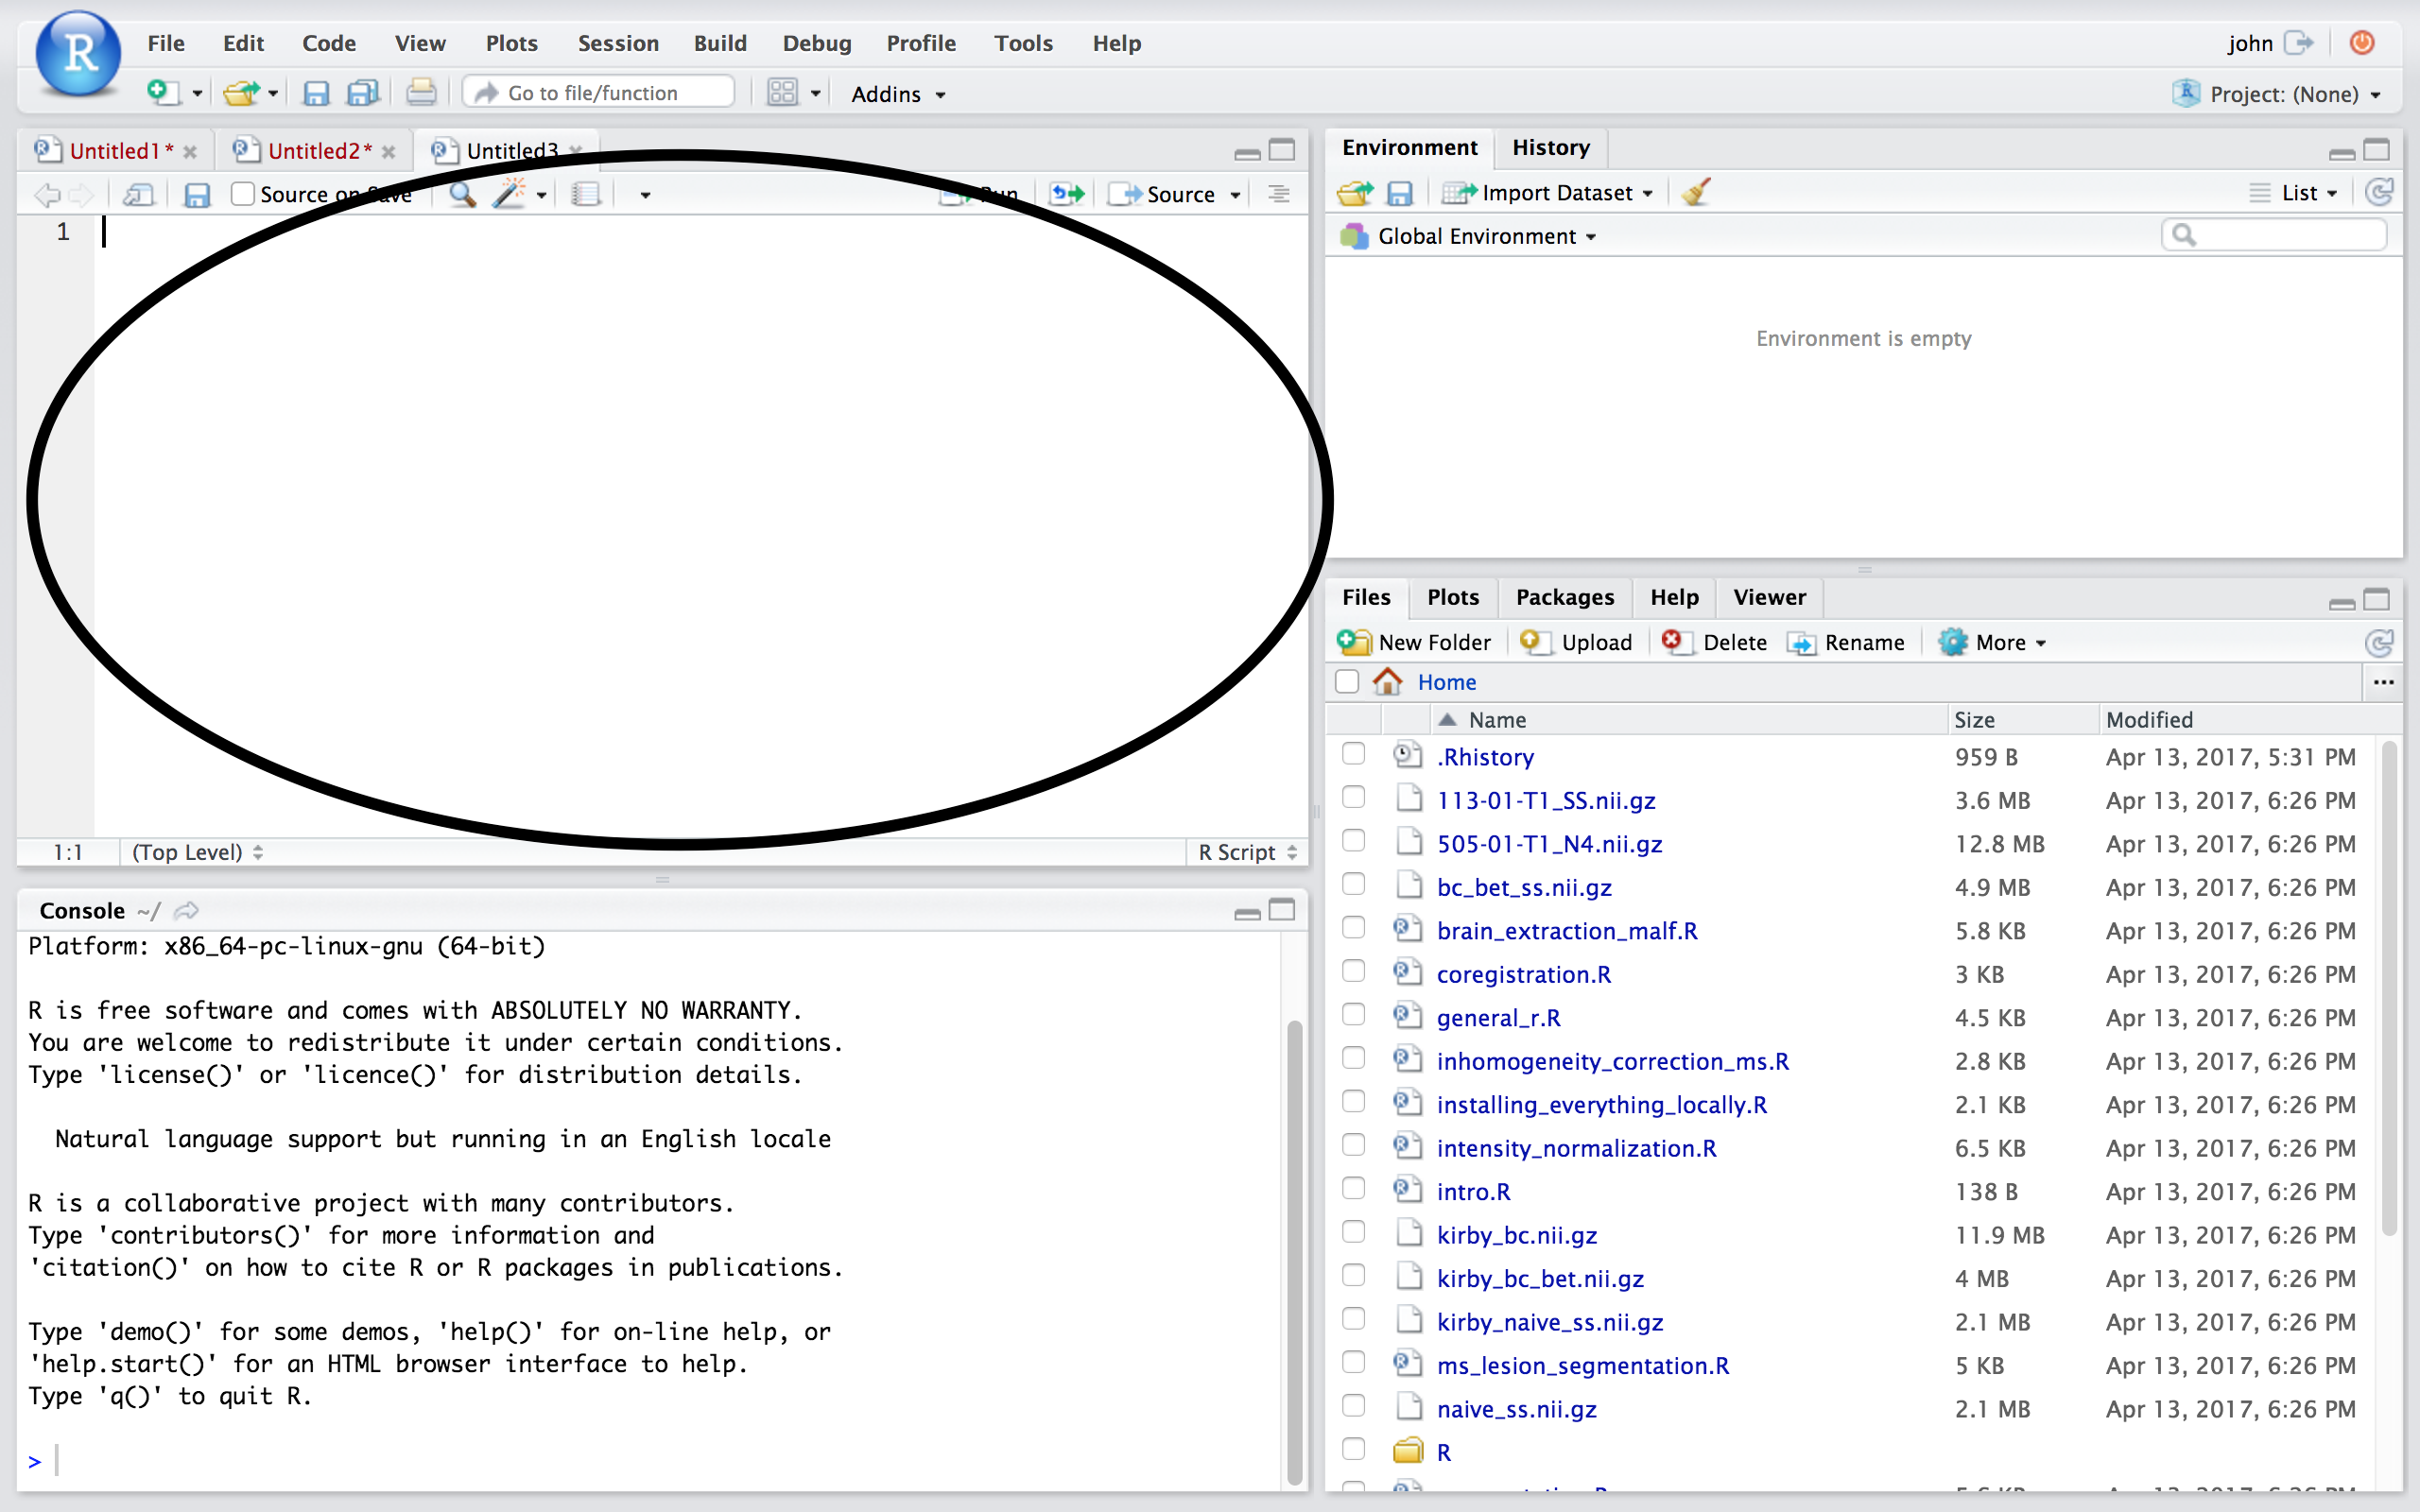 ## Workspace/Environment
* Tells you what **objects** are in R
* What exists in memory/what is loaded?/what did I read in?
**History**
* Shows previous commands. Good to look at for debugging, but **don't rely** on it as a script. Make a script!
* Also type the "up" key in the Console to scroll through previous commands
## Workspace/Environment
## Workspace/Environment
* Tells you what **objects** are in R
* What exists in memory/what is loaded?/what did I read in?
**History**
* Shows previous commands. Good to look at for debugging, but **don't rely** on it as a script. Make a script!
* Also type the "up" key in the Console to scroll through previous commands
## Workspace/Environment 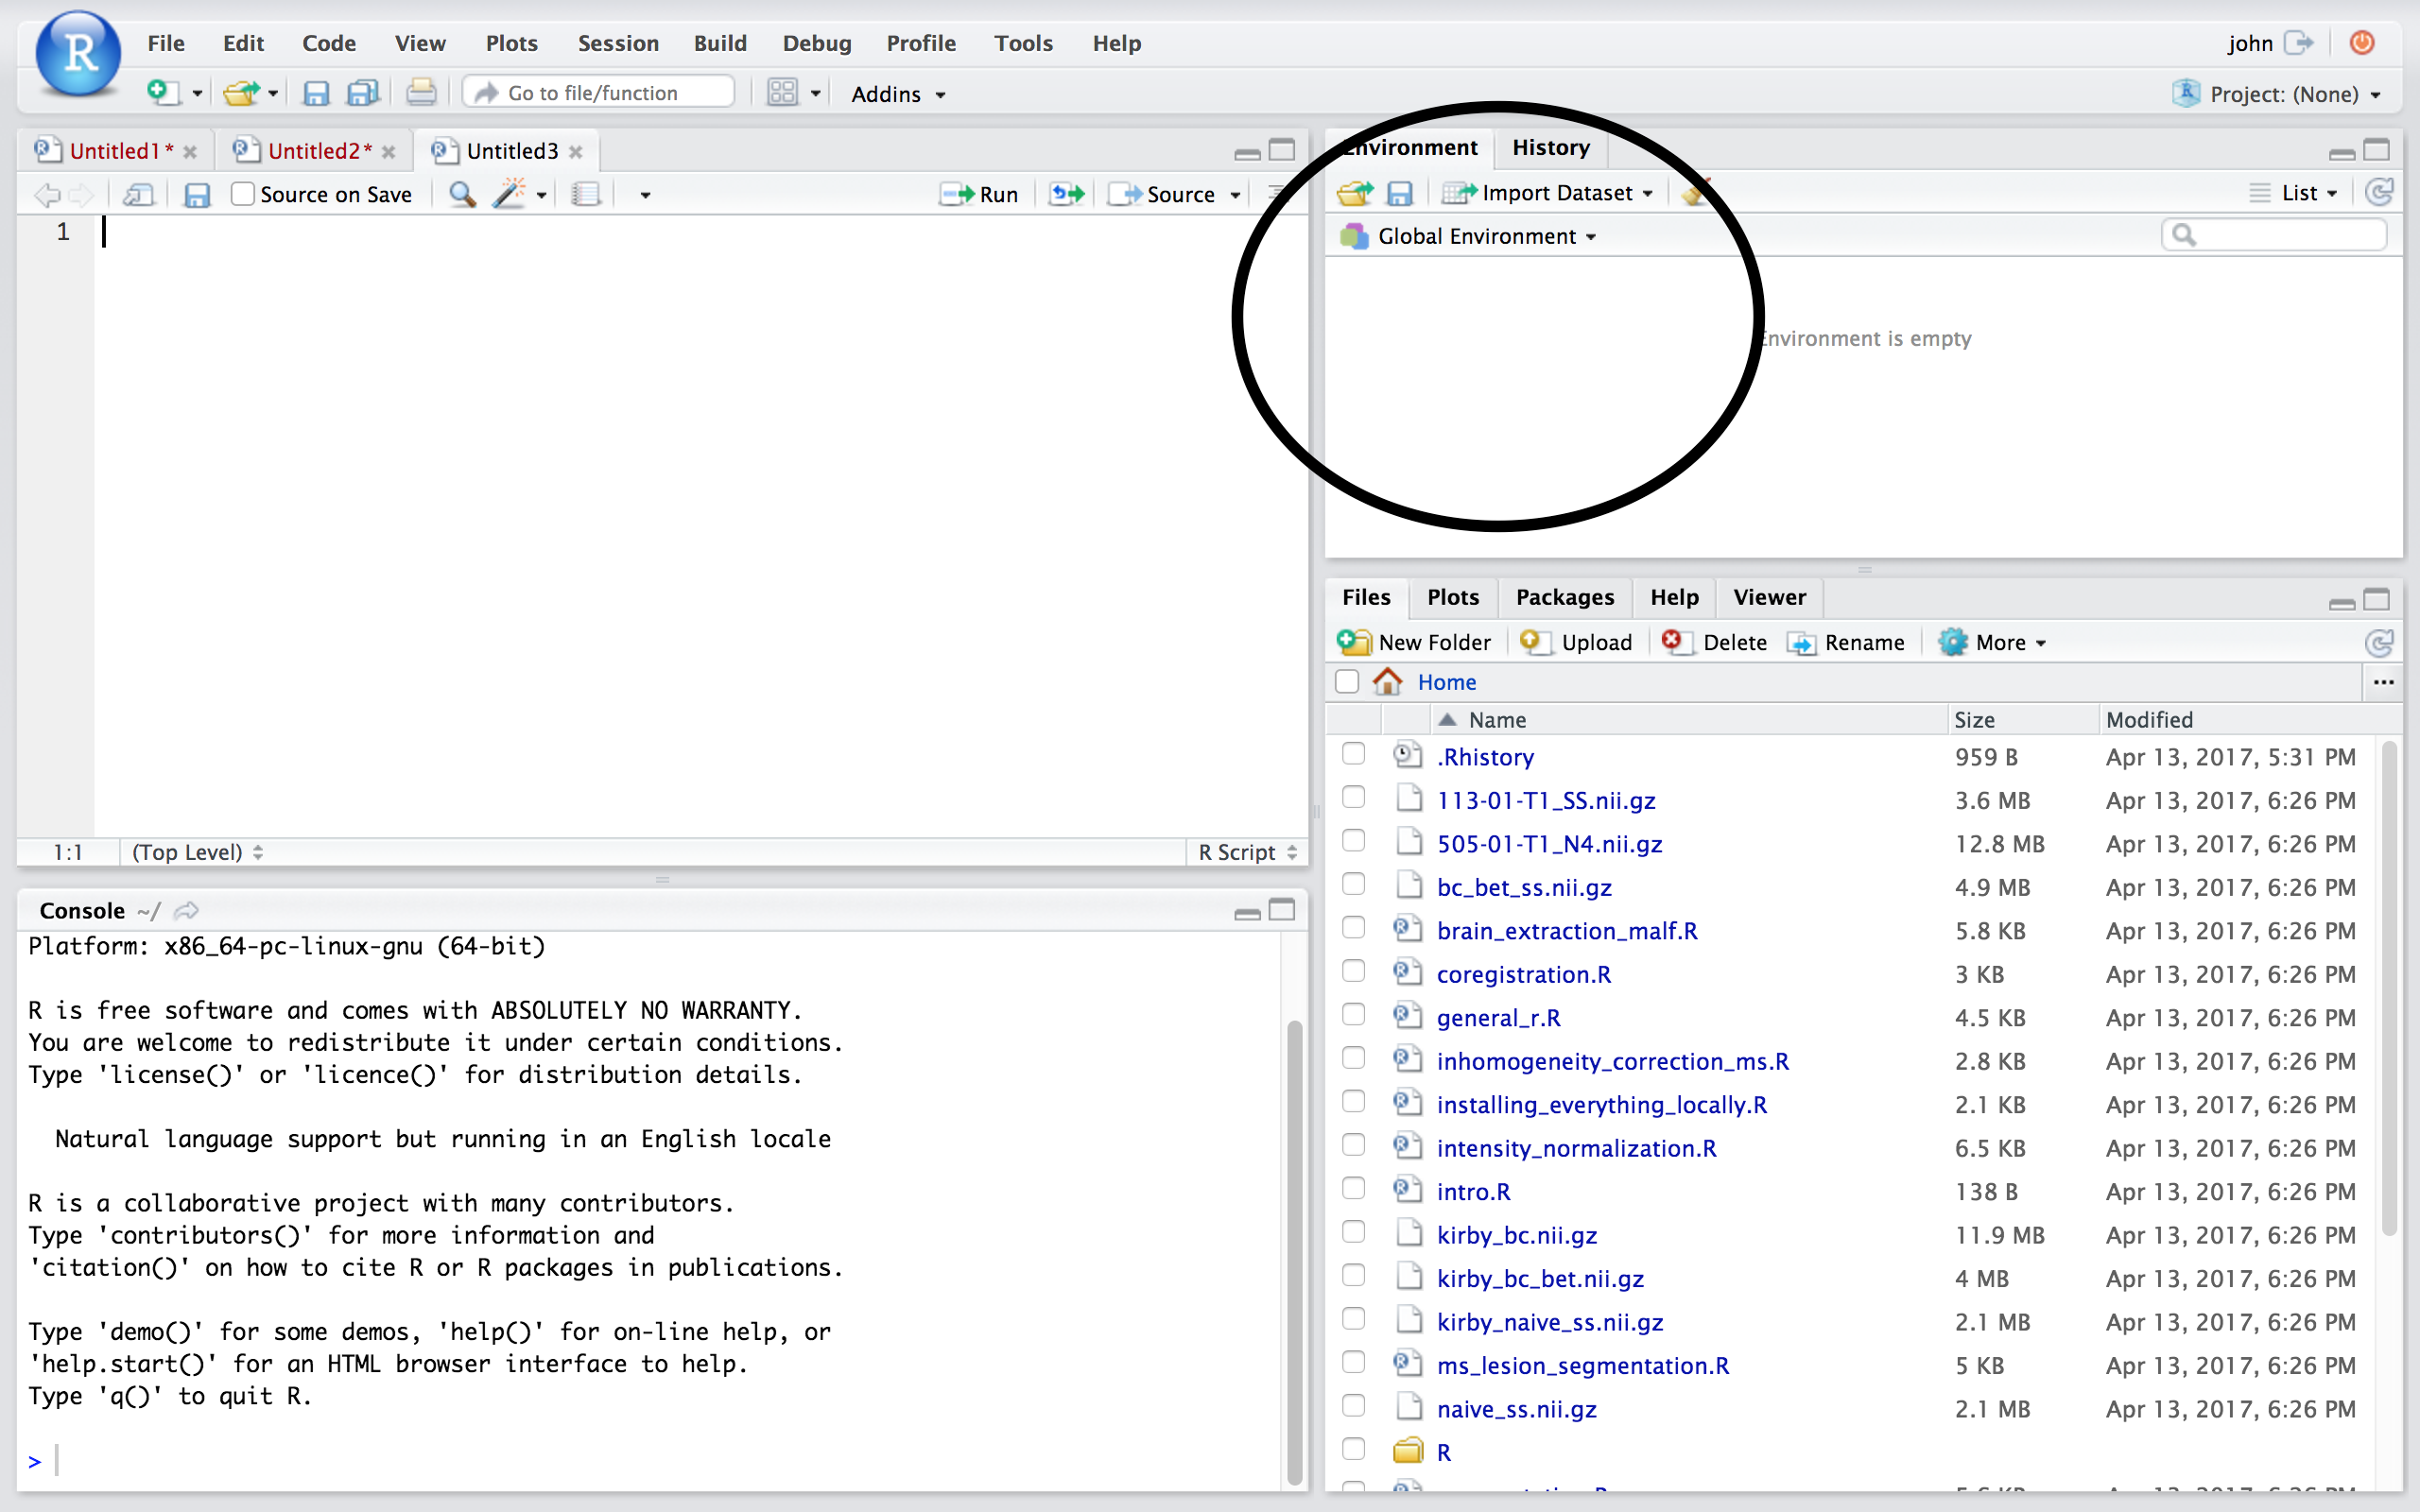 ## Other Panes
* **Files** - shows the files on your computer of the directory you are working in
* **Viewer** - can view data or R objects
* **Help** - shows help of R commands
* **Plots** - pretty pictures
* **Packages** - list of R packages that are loaded in memory
## Website
http://johnmuschelli.com/imaging_in_r
## References {.smaller}
## Other Panes
* **Files** - shows the files on your computer of the directory you are working in
* **Viewer** - can view data or R objects
* **Help** - shows help of R commands
* **Plots** - pretty pictures
* **Packages** - list of R packages that are loaded in memory
## Website
http://johnmuschelli.com/imaging_in_r
## References {.smaller}