Why use this for Exploratory Data Analysis (EDA)/ Quality Checking (QC)
Respects true nature of data (brains are not slices!)
Can get more of an overview
Motion - can look and interact to see if there are problems
Some things become more apparent in 3D
Things Hiding in 2D
Real Life Example:
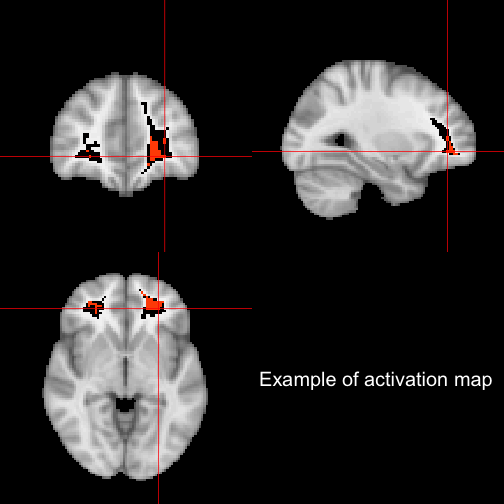
SubLIME is a MS lesion detection algorithm [(Sweeney, Shinohara, Shea, et al., 2012)].
MS - SUBLIME
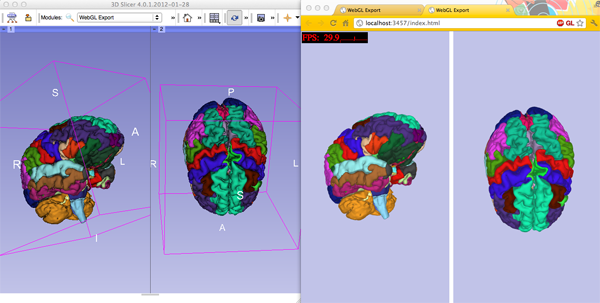
before 3D rendering - didn't notice misregistration
RGL Caveats
So RGL rendering is perfect, right?
RGL Caveats
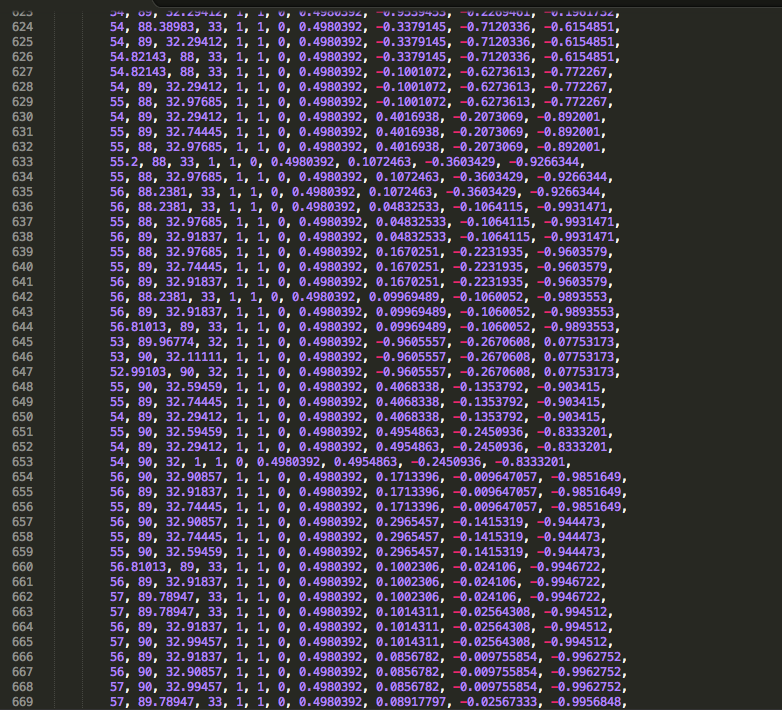
Size of gzipped NIfTI file : 418Kb, unzipped 4Mb
Size of html output : 30Mb
WebGL can only hold 65535 points in an object - need to break up
http://biostat.jhsph.edu/~jmuschel/code/WebGL_Example.zip has example of how to do this (thanks to Duncan Murdoch)
Also hard to see what's going on in the html
Markdown - Use R!
Integration into knitr is working - webgl hook
Exporting the html first, then embedding in html works fine
RStudio's default doesn't open md's over 2Mb (brain was 30Mb)
shiny integration is possible, but slow depending on system
Meta-Interactive? Interactive control over interactive graphics
slidify works with it (used in this presentation)
Conclusion
Currently - very good for internal reports/EDA
Can integrate into new knitting tools
Not accepted as figures in publication in
Need journals that can handle
You can still include standard figures in text with supplemental material
Available methods allow for reproducibility
Thanks
Ciprian Craniceanu and Brian Caffo - SMART Group
Elizabeth Sweeney
Duncan Murdoch - otherwise I'd still be presenting distorted brains
Biblio
WHhat
Here are the steps. Need a structure 4D - over time or multiple ROIs
Slide 1
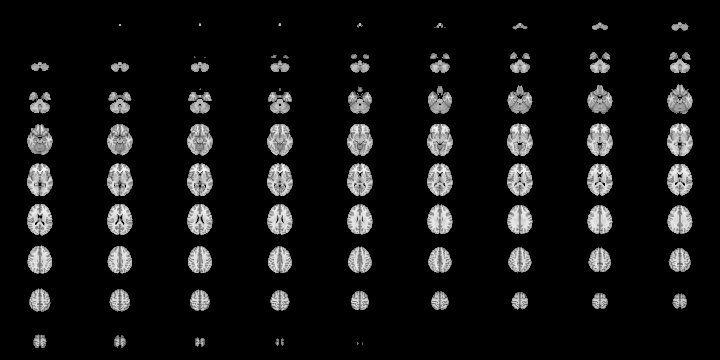
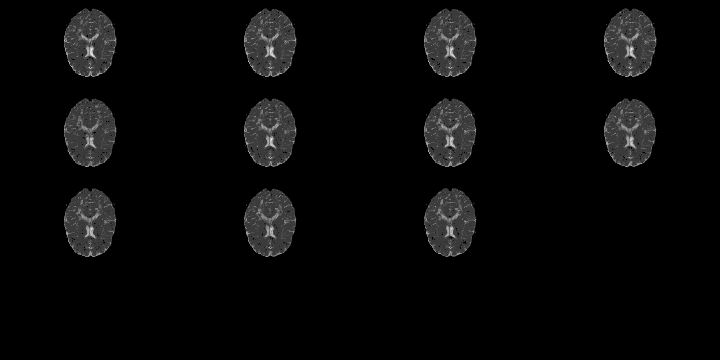
Functional brain imaging (e.g. fMRI, PET, EEG) data is a 4-dimensional time series representing changes in brain activity over time.
Structrual imaging (e.g. MPRAGE, DTI, CT) also has been increasingly more common to have a longitudinal component, where participants/subjects are scanned multiple times.
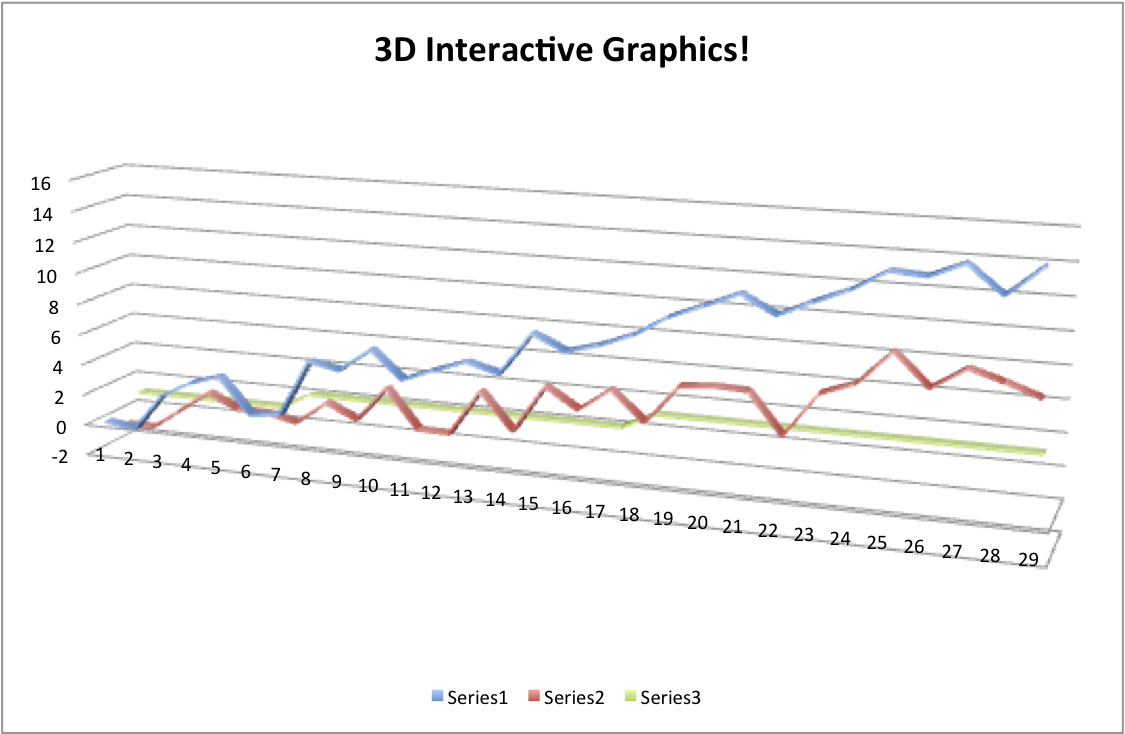
Visualization and presentation of these data can be improved with the use of 3D tools.
 ---
---